.svg)
.svg)
.svg)


%201.svg)
Key Takeaways
- Statistical significance ensures A/B test results reflect genuine performance differences rather than random variation—minimum 95% confidence level prevents implementing changes that appear to improve conversion but actually harm it through false positive conclusions
- Proper sample size calculation before testing begins determines how long tests must run to detect meaningful performance differences reliably—skipping this calculation produces underpowered tests that miss real improvements or declare random variation as significant results
- Hypothesis development following structured frameworks transforms vague testing intuitions into specific, measurable, falsifiable predictions that produce learning regardless of whether tests win or lose
- Test isolation—changing single variables within controlled experiments—enables confident attribution of performance differences to specific changes rather than confounding multiple simultaneous modifications that prevent clear causal conclusions
- Post-test analysis extending beyond primary conversion metrics reveals segment-specific effects, secondary metric impacts, and long-term performance patterns that headline conversion rate improvements can obscure
A Perth e-commerce business selling outdoor equipment ran what their marketing manager described as "continuous A/B testing." New homepage hero image tested against original. Button colour changed and measured. Navigation reorganised and compared. Tests typically ran for one to two weeks regardless of traffic volumes. Winners were declared when one variant showed higher conversion regardless of statistical confidence. Changes accumulated rapidly—the team felt productive, constantly optimising.
Twelve months later, overall conversion rate had declined 0.8% despite dozens of "winning" tests being implemented. The paradox confused the team—how could implementing winners produce declining overall performance?
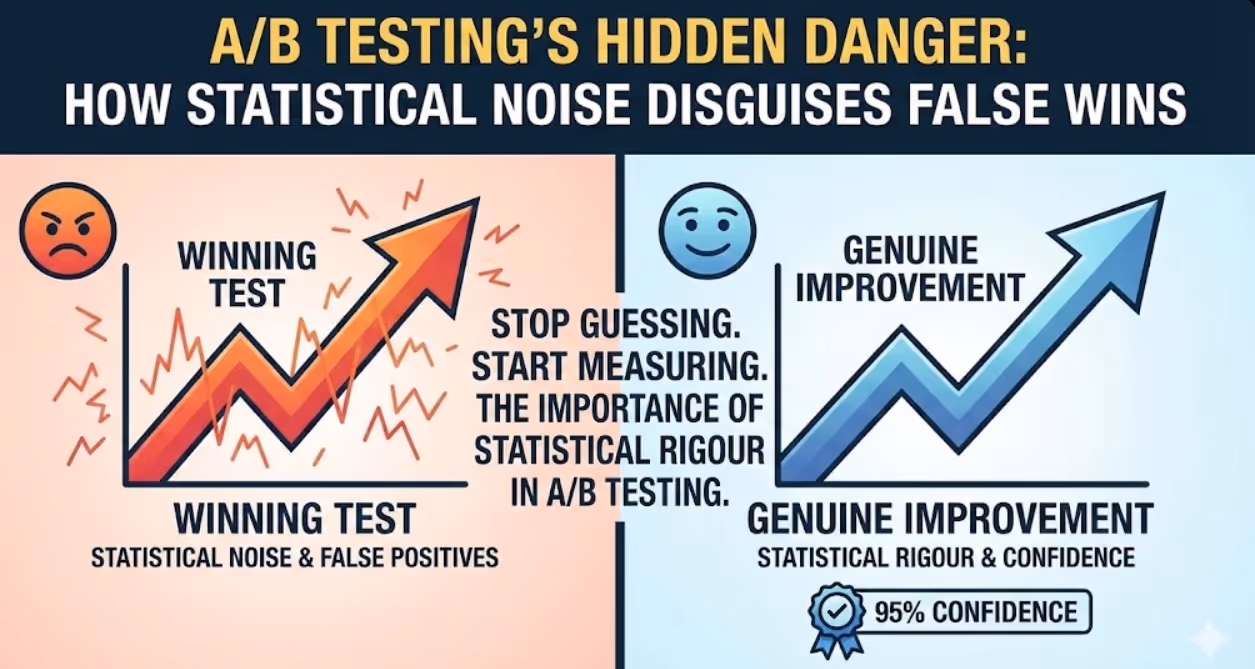
Statistical analysis revealed the problem immediately. Most tests had been declared with fewer than 40 conversions per variant—statistically meaningless sample sizes producing random results that happened to favour one variant through chance. The "winners" weren't genuine improvements—they were statistical noise masquerading as meaningful data. Implementing random changes had degraded rather than improved overall conversion through accumulated noise.
They restarted with proper statistical framework—minimum 95% confidence thresholds, sample size calculations before each test, minimum test durations covering full business cycles, and isolation of single variables per test. First three properly designed tests produced genuine winners. Conversion rate improved 2.3% within four months from three reliable optimisations—more than recovering the year of noise-based decline through rigorous statistical practice.
According to research from Optimizely, businesses implementing statistically rigorous A/B testing frameworks improve conversion rates 2-4x faster than those running informal split tests without statistical controls, demonstrating that testing quality matters more than testing quantity.
Understanding Statistical Foundations for A/B Testing
Statistical concepts underlying A/B testing determine whether test conclusions are reliable—investing time understanding these foundations prevents costly misinterpretation of testing results.
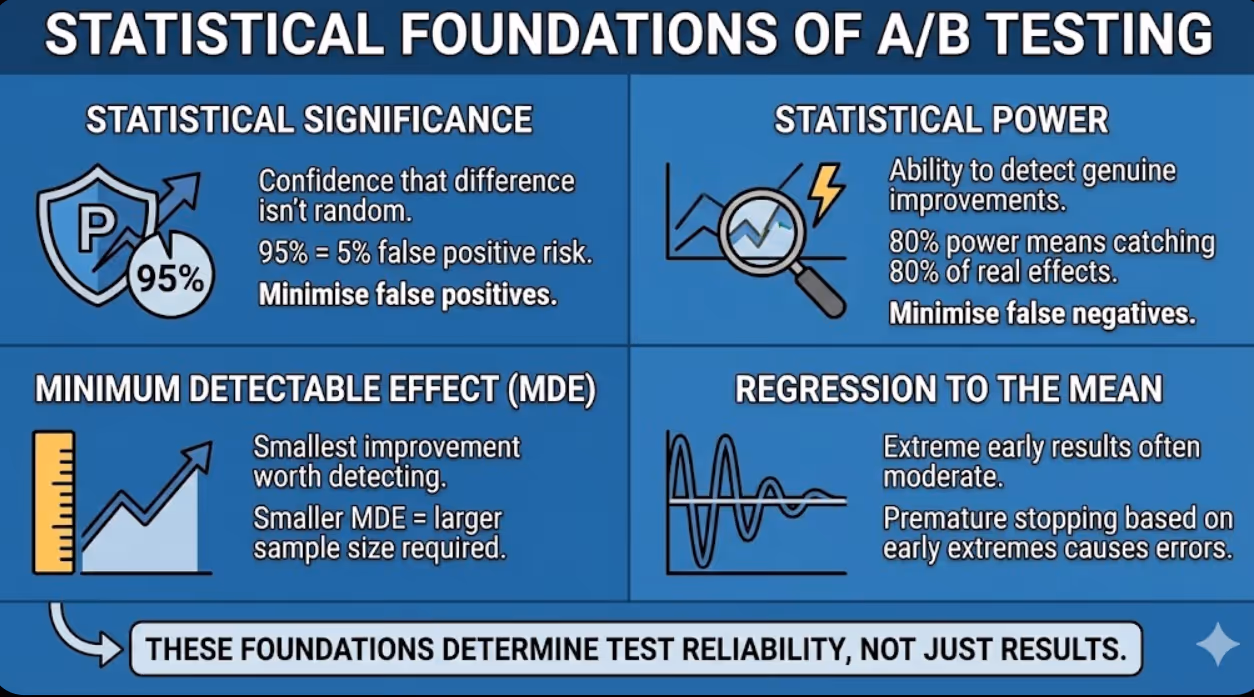
Statistical significance measures confidence that observed performance differences between variants reflect genuine effects rather than random chance. Expressed as p-value (probability that observed difference occurred by random chance alone) or confidence level (1 minus p-value), statistical significance answers: if these variants performed identically, how likely would we observe a difference this large or larger by random variation alone? At 95% confidence (p-value of 0.05), we accept 5% probability that our declared winner actually performs identically to control—false positive risk we're willing to accept. Higher confidence thresholds (99%) reduce false positive risk but require larger sample sizes or longer test durations to achieve.
Statistical power measures a test's ability to detect genuine performance differences when they actually exist—the complement to significance addressing false negatives (missing real improvements). Standard testing practice targets 80% power, meaning tests with this configuration will detect genuine performance differences 80% of the time, missing 20% of real improvements through under-powered test designs. Power is determined by sample size, effect size (magnitude of conversion improvement you're trying to detect), and significance threshold—smaller effects require larger samples to detect reliably at equivalent significance levels.
Minimum detectable effect (MDE) defines the smallest conversion rate improvement your test is designed to detect reliably. Choosing appropriate MDE before testing balances realistic improvement expectations against required sample sizes. Testing designed to detect 1% absolute conversion improvement (from 3% to 4%) requires substantially larger samples than testing designed to detect 5% improvement—because smaller effects are harder to distinguish from random variation. Setting MDE based on what improvement would actually justify implementing the change (not what would be statistically convenient to detect) ensures tests are designed around commercial relevance rather than statistical convenience.
Type I and Type II errors represent the two ways statistical testing fails. Type I errors (false positives) occur when tests declare winners that actually perform identically to control—implementing harmful or neutral changes based on random variation. Type II errors (false negatives) occur when tests fail to detect genuine improvements that actually exist—abandoning effective changes because underpowered tests couldn't distinguish real effects from noise. Significance threshold controls Type I error rate; power controls Type II error rate. Optimising both requires sufficient sample sizes—the fundamental reason that testing without sample size calculation produces unreliable results regardless of other testing discipline.
Regression to the mean explains why early test results frequently don't reflect final outcomes—extreme initial performance (very high or very low conversion for either variant) tends to moderate toward true performance as sample sizes increase. Tests showing dramatic early differences often converge toward smaller final differences as sample accumulates. This statistical phenomenon explains why premature test stopping based on early results—even when seemingly dramatic—produces a disproportionate share of false positive conclusions. Early stopping bias is one of the most common and costly statistical errors in Australian business A/B testing programmes.
Novelty effects create temporary performance changes from user response to newness rather than genuine preference for tested variants. New design elements, copy approaches, or interaction patterns sometimes initially attract higher engagement through curiosity before settling at true performance levels as novelty fades. Tests running insufficient duration to outlast novelty effects declare winners based on temporary engagement spikes that don't represent sustainable conversion improvements. Running tests for minimum two to four weeks—even when sample size requirements are met earlier—helps ensure novelty effects have dissipated before declaring results.
Simpson's paradox warns that aggregate test results can point opposite directions from segment-level results due to compositional differences between variant traffic. A variant appearing to improve overall conversion might actually harm conversion for your highest-value customer segment whilst improving conversion for lower-value segments representing larger traffic volumes. Always analyse segment-level results alongside aggregate outcomes—Simpson's paradox is particularly relevant for Australian businesses serving geographically diverse audiences where segment composition varies between variants.
Developing Testable Hypotheses

Structured hypothesis development transforms testing intuitions into specific, measurable predictions that produce learning regardless of test outcomes.
Hypothesis structure framework requires five components for testable A/B test hypotheses. Observation documents specific evidence motivating the test—heatmap findings, session recording patterns, survey responses, or analytical data revealing potential friction or opportunity. Problem statement articulates what the observation suggests about current performance—"visitors are not seeing the primary call-to-action before abandoning." Proposed change specifies exactly what will be modified—"move call-to-action above the fold and increase button size to 44px minimum touch target." Expected outcome predicts measurable impact—"add-to-cart conversion rate on product pages will increase by minimum 15%." Measurement method defines how outcome will be measured—"GA4 goal completion rate for add-to-cart events on product pages, measured at 95% confidence with 80% power."
Evidence-based hypothesis prioritisation focuses testing resources on changes most likely to produce meaningful improvements. Hypotheses supported by multiple evidence sources—heatmap data showing low CTA engagement, session recordings showing visitors scrolling past CTAs, exit surveys citing inability to find purchase option—warrant higher testing priority than single-source intuitions. Quantified evidence (a specific exit rate, scroll depth threshold, or engagement metric) produces more precise hypotheses than qualitative observations alone. Prioritisation frameworks including ICE (Impact, Confidence, Ease) scoring or PIE (Potential, Importance, Ease) scoring rank hypothesis backlog enabling systematic testing prioritisation rather than testing whatever seems interesting or easiest.
Commercial impact estimation connects hypothesis testing priority to revenue potential. Calculate expected revenue impact if hypothesis proves correct: current monthly conversions × estimated conversion improvement percentage × average order or contract value × implementation confidence = expected monthly revenue recovery. This calculation serves dual purposes—prioritising highest-revenue-impact tests before lower-impact alternatives, and creating testable financial predictions enabling post-test ROI evaluation. Australian businesses with finite testing capacity should concentrate on hypotheses with substantial commercial potential rather than testing marginal elements unlikely to move business-significant metrics even if statistical significance is achieved.
Counterintuitive hypothesis value recognises that testing ideas you believe will improve conversion is less valuable than testing ideas where you're genuinely uncertain. If you're confident a change improves conversion, implement it without testing—testing primarily serves to resolve genuine uncertainty where intuition or evidence provides insufficient confidence for implementation decisions. The most valuable tests are those where team members reasonably disagree about expected outcomes—resolving genuine disagreement through data builds institutional knowledge beyond individual test results.
Null hypothesis framing clarifies what test results actually demonstrate. The null hypothesis states that variants perform identically—that any observed difference reflects random variation. Rejecting the null hypothesis (achieving statistical significance) indicates the variants likely don't perform identically, providing evidence supporting the alternative hypothesis that one variant genuinely outperforms the other. Failing to reject the null doesn't prove variants perform identically—it means insufficient evidence exists to confidently conclude they differ. This distinction matters practically: negative tests suggest the change being tested doesn't produce detectable improvement, not that the underlying problem doesn't exist.
Sample Size Calculation and Test Planning
Proper sample size calculation before testing begins is the single most important statistical practice distinguishing reliable from unreliable A/B testing programmes.
Sample size calculator inputs require four parameters for accurate calculation. Baseline conversion rate reflects current performance of the control experience—use actual data from GA4 or platform analytics rather than assumed or aspirational conversion rates. Minimum detectable effect specifies the smallest absolute or relative improvement worth detecting—typically 10-20% relative improvement for most commercial testing contexts. Statistical significance threshold sets acceptable false positive risk—95% confidence (5% significance level) for standard testing, 99% for high-stakes decisions. Statistical power level sets acceptable false negative risk—80% power is standard, 90% for critical decisions. Free sample size calculators including Evan Miller's A/B test calculator and Optimizely's sample size tool calculate required sample sizes from these inputs.
Australian traffic volume reality check assesses whether planned tests are feasible given actual site traffic. A test requiring 5,000 conversions per variant is impractical for an Australian SME generating 200 monthly total conversions—completion would require over four years. For lower-traffic sites, adjust MDE upward (accepting that only larger improvements are detectable) or focus testing on higher-traffic pages and funnel stages where sample accumulates faster. Traffic-constrained Australian businesses should prioritise testing highest-traffic pages first, ensuring testing resources concentrate where statistical power is achievable within reasonable timeframes.
Test duration planning sets appropriate observation windows beyond sample size requirements. Minimum test duration should cover complete business cycles—typically two to four weeks for most Australian businesses to capture weekly variation in conversion behaviour, including weekend versus weekday pattern differences. Extend duration for businesses with monthly purchasing cycles (B2B decisions, large-ticket purchases) where weekly data doesn't capture complete decision-making timelines. Never end tests early because one variant appears to be winning—early stopping is statistically equivalent to peeking at results and stopping when they're favourable, which dramatically inflates false positive rates.
Multiple variant testing implications require adjustment to standard sample size calculations. Testing control against two variants simultaneously (A/B/C testing) requires adjusting for multiple comparison problems—the probability of false positives increases with each additional variant being compared. Apply Bonferroni correction (divide significance threshold by number of comparisons) or use platforms implementing appropriate multiple comparison corrections automatically. Practically, testing three or more variants simultaneously requires substantially larger sample sizes or accepting higher false positive risk than two-variant testing—most Australian SMEs should focus on two-variant testing for statistical tractability.
Segmented testing considerations acknowledge that aggregate sample size targets may require substantially more total traffic when segment-specific analysis is planned. If you intend to analyse test results separately for mobile versus desktop visitors, each segment must individually meet sample size requirements—not just aggregate test totals. Planned segment analysis should inform total sample size calculations before testing begins rather than creating underpowered segment analysis from tests designed only for aggregate statistical validity.

Test Implementation Best Practices
Proper test execution prevents implementation errors that corrupt statistical validity regardless of how well hypothesis development and sample size planning were conducted.
Randomisation verification ensures visitors are correctly and consistently assigned to test variants. Traffic splitting should be genuinely random (not alternating, time-based, or systematically biased), consistent (same visitor sees same variant across sessions through cookie or user ID-based assignment), and proportional (equal traffic allocation to variants unless intentionally unequal for risk management). Verify randomisation implementation through quality assurance testing before launching live experiments—traffic allocation errors invalidate statistical analysis regardless of subsequent data collection quality.
Isolation of single variables enables confident causal attribution of performance differences. Changing headline copy and button colour simultaneously prevents determining which change drove results—both might improve conversion but in opposite directions, or one might improve conversion whilst the other harms it. Single-variable isolation is particularly important for Australian businesses beginning testing programmes where institutional knowledge about what influences conversion is limited. Experienced testing teams with substantial prior results can occasionally justify multivariate testing when single-variable isolation has already established the influence of relevant variables.
Quality assurance across devices and browsers prevents technical implementation errors affecting variant delivery. Test both control and variant experiences across Chrome, Firefox, Safari, and Edge browsers on desktop, and iOS Safari and Android Chrome on mobile—Australia's dominant browser configurations. Verify correct variant display on different screen sizes, check that conversion tracking fires correctly for both variants, and confirm no technical errors affect either variant exclusively. Platform-specific rendering differences sometimes cause variants to display incorrectly on specific device/browser combinations—QA testing catches these errors before they corrupt live test data.
Exclusion list management prevents contaminating test populations with visitors who shouldn't influence results. Internal team members visiting the site should be excluded from test populations through IP filtering or cookie exclusion to prevent team testing activity inflating conversion rates for specific variants they visit more frequently. Bot traffic should be filtered from conversion calculations—some testing platforms include bot detection whilst others require manual filtering through analytics platform configurations. Development and staging environment traffic should never mix with production test data.
Pre-test data validation establishes baseline performance metrics before variant exposure begins. Document control conversion rates for two to four weeks preceding test launch, verify conversion tracking accuracy through test conversions, and confirm that normal conversion rate variation patterns are understood. Unusual pre-test performance (conversion rate spike or drop from unrelated factors) should postpone test launch until normal baseline conditions are restored—testing during abnormal periods produces results that may not generalise to typical operating conditions.
Test documentation creates institutional knowledge enabling future testing programmes to build on accumulated learning. Document for each test: hypothesis, test start and end dates, traffic allocation, results for all metrics, statistical confidence achieved, decision made, and reasoning behind implementation or rejection decisions. Maintained testing logs enable pattern recognition across tests—discovering that headline copy tests consistently outperform design tests for your audience informs future test prioritisation more reliably than individual test results alone.
Statistical Analysis and Result Interpretation
Rigorous result interpretation requires understanding what test statistics do and don't demonstrate—particularly avoiding common misinterpretations that undermine testing programme reliability.
Primary metric analysis evaluates test results against the hypothesis metric defined during test planning. Calculate conversion rates for both control and variant, compute observed difference and percentage improvement, determine statistical significance using your chosen calculator or testing platform, and compare achieved confidence against your pre-determined threshold. Only declare winners when significance threshold is genuinely met—psychological pressure to declare winners from tests approaching but not reaching significance thresholds is one of the most common sources of false positive errors in Australian business testing programmes.
Secondary metric analysis checks whether primary metric improvements come at the cost of other important performance indicators. A checkout page test improving conversion rate whilst reducing average order value might harm total revenue despite appearing successful on primary metric. Test variants improving email signup rates whilst reducing downstream purchase conversion might optimise an intermediate metric at the expense of ultimate commercial outcomes. Always analyse revenue per visitor, average order value, and downstream conversion rates alongside primary test metrics before declaring winners and implementing changes.
Segment analysis investigates whether aggregate results mask important variation across visitor groups. Analyse test results separately for mobile and desktop visitors—winning variants for desktop sometimes perform neutrally or negatively on mobile, requiring segment-specific implementation decisions. Examine results by traffic source (paid versus organic versus direct) as different audiences sometimes respond differently to identical changes. Geographic segment analysis is particularly relevant for Australian businesses serving diverse state and territory markets where audience characteristics and purchasing behaviour differ meaningfully.
Confidence interval interpretation provides richer information than binary significant/not-significant conclusions. Confidence intervals express the range within which true performance difference likely falls—a 95% confidence interval from +0.5% to +3.2% improvement indicates genuine improvement while acknowledging substantial uncertainty about its magnitude. Wide confidence intervals (from -1% to +5%) indicate insufficient data for precise effect estimation even if statistical significance is achieved. Confidence intervals enable more nuanced implementation decisions than binary significance conclusions—particularly for borderline results where point estimates are positive but confidence intervals include zero.
Practical significance versus statistical significance distinction prevents implementing statistically significant but commercially trivial improvements. A test achieving 99% confidence that one variant converts 0.05% better than control demonstrates statistical significance whilst delivering negligible commercial impact—implementing based solely on statistical significance ignores practical relevance. Always evaluate whether statistically significant improvements represent commercially meaningful magnitudes justifying implementation effort and risk. Conversely, practically significant improvements (large effect sizes) failing to achieve statistical significance due to insufficient sample size represent inconclusive rather than negative results—the test was underpowered for detecting effects of the magnitude observed.
Sequential testing problems arise when results are monitored continuously and tests stopped when significance thresholds are crossed. Peeking at test results and stopping when a variant achieves significance exploits natural variance—by random chance, variants will temporarily cross significance thresholds during testing even when performing identically. Stopping at these crossing points dramatically inflates false positive rates. Avoid continuous monitoring during tests, set fixed analysis dates before testing begins, and analyse results only at pre-determined checkpoints rather than continuously watching for favourable results.

Building a Testing Programme Culture
Sustainable testing programmes require organisational culture supporting disciplined testing practice rather than pressure for quick results that undermines statistical integrity.
Velocity versus rigour balance addresses the tension between testing speed and statistical reliability. High-velocity testing—rapid iterations without statistical controls—generates activity that feels productive whilst producing unreliable results. Slow, rigorous testing produces fewer but more reliable insights. Optimal testing cultures prioritise reliability over velocity, accepting that properly designed tests take longer to complete but produce genuine improvements that accumulate into significant performance gains, whilst fast-but-flawed testing programmes generate noise that occasionally improves performance through luck rather than systematic optimisation.
Negative result valuation prevents testing culture from treating non-significant results as failures. Tests failing to detect significant differences provide valuable information—confirming that tested changes don't produce detectable improvements eliminates them from future consideration, preventing resources being wasted implementing and maintaining changes that don't affect conversion. Document and share negative results as actively as positive ones—teams that hide or minimise negative results accumulate repeated testing of similar ideas whose failure wasn't broadly communicated.
Stakeholder expectation management for Australian businesses requires educating leadership about appropriate testing timelines and result interpretation. Monthly testing reviews discussing results in progress create pressure for premature conclusions—monthly cadence is appropriate for reviewing completed tests and planning new ones, not for mid-test status updates that invite early stopping decisions. Help stakeholders understand that the goal is not maximum tests completed but maximum reliable conversion improvements implemented—shifting success metrics from testing activity volume to implemented improvement quality.
Iterative testing mindset treats individual tests as elements of ongoing learning programmes rather than isolated experiments. Test results—whether positive, negative, or inconclusive—generate learning that informs subsequent hypothesis development. Positive results suggest follow-on tests exploring related optimisation opportunities. Negative results suggest hypothesised mechanisms don't operate as expected, informing revised hypotheses. Inconclusive results suggest insufficient traffic for reliable testing or smaller-than-expected effects, informing MDE adjustments and testing prioritisation revisions.

Tools for Australian A/B Testing Programmes
Platform selection should match testing programme scale, technical capability, and statistical sophistication requirements rather than defaulting to most recognised brand names.
Google Optimize was discontinued in September 2023, requiring Australian businesses previously using it to migrate to alternative platforms. Businesses remaining on Google Optimize after discontinuation are running tests without data collection—migration is urgent for affected organisations.
VWO (Visual Website Optimiser) provides comprehensive testing capabilities including A/B testing, multivariate testing, split URL testing, and personalisation through visual editor requiring minimal development involvement. VWO's SmartStats Bayesian testing engine provides more nuanced statistical analysis than traditional frequentist approaches. Pricing starts around $199 USD monthly for basic plans with enterprise pricing for advanced features. VWO suits Australian mid-market businesses wanting comprehensive testing capabilities with accessible visual implementation tools.
Optimizely serves enterprise testing requirements with sophisticated experimentation platform including feature flagging, server-side testing, and advanced statistical analysis. Optimizely's pricing is enterprise-focused—contact sales for Australian market pricing. Optimizely's Stats Engine uses sequential testing methodology addressing peeking problems through always-valid inference. Enterprise-scale Australian businesses with substantial digital revenue justifying premium investment benefit most from Optimizely's sophisticated capabilities.
AB Tasty provides mid-market testing platform with visual editor, advanced targeting, and AI-powered personalisation capabilities. AB Tasty's comprehensive feature set including testing, personalisation, and feature management suits Australian businesses wanting integrated experimentation and personalisation without enterprise platform pricing. Pricing is quote-based—contact for Australian market pricing.
Convert Experiments offers privacy-focused testing platform with GDPR compliance features relevant for Australian businesses with European audience exposure and Australian privacy compliance requirements. Convert's plans start around $699 USD monthly providing unlimited experiments with advanced targeting. Convert suits privacy-conscious Australian businesses wanting robust testing without the data privacy concerns some enterprise platforms create.
Crazy Egg includes basic A/B testing alongside heatmap and session recording capabilities, making it suitable for Australian SMEs wanting integrated behaviour analytics and testing within single platform. Testing functionality is less sophisticated than dedicated testing platforms but may be adequate for businesses beginning testing programmes without requirements for advanced statistical features.
Google Optimizely (not to be confused with the discontinued Google Optimize) refers to the integration between Google Analytics 4 and third-party testing platforms through GA4's event-based architecture enabling conversion tracking from any testing platform through GA4's measurement infrastructure. This integration doesn't replace dedicated testing platforms but enhances their conversion tracking reliability through GA4's comprehensive measurement capabilities.

Frequently Asked Questions
What statistical significance level should Australian businesses use for A/B tests, and when is it appropriate to use lower thresholds like 90% confidence?
Standard practice for most Australian business A/B testing uses 95% confidence (p-value of 0.05) as the minimum threshold for declaring test winners—this threshold reflects reasonable balance between false positive risk and required sample sizes for most commercial testing contexts. Use 99% confidence for high-stakes decisions where implementing incorrect winners creates substantial costs or risks—major website redesigns, fundamental checkout flow changes, pricing experiments, and tests on highest-revenue pages where false positives have large commercial consequences. Lower 90% confidence thresholds are sometimes appropriate for low-stakes, easily reversible tests where implementing a false positive has minimal negative consequences and quickly reverting is straightforward. Never use below 90% confidence for any commercial testing decisions—80% confidence means 20% probability that your declared winner is actually performing identically or worse than control, representing unacceptable false positive risk for business decisions. The appropriate threshold is a business decision reflecting consequence severity of false positives rather than arbitrary statistical convention.
How should Australian businesses handle A/B testing during peak seasons like Christmas, EOFY sales, and public holiday periods when traffic and behaviour patterns differ significantly from normal periods?
Peak season testing requires careful consideration of whether results will generalise to normal operating conditions. Tests run exclusively during peak periods (Christmas trading, EOFY sales) attract visitors with different purchase intent, urgency levels, and decision-making behaviour than typical periods—optimisations effective for high-intent peak visitors may underperform for normal-intent visitors representing the majority of annual traffic. Avoid launching new tests during first and last weeks of significant peak periods when behaviour is most atypical. If tests are running when peak periods begin, consider pausing and restarting after peak periods conclude rather than declaring results from mixed normal-and-peak-period data. For businesses where peak periods represent the majority of annual revenue, testing during peak seasons with explicit acknowledgement that results may not generalise to off-peak periods is sometimes necessary—but requires testing during subsequent off-peak periods to validate generalisability before permanent implementation.
How can Australian SMEs with limited monthly traffic volumes run effective A/B testing programmes when sample size requirements seem impossibly large?
Traffic-constrained Australian SMEs can adapt testing approaches rather than abandoning testing entirely because ideal sample sizes aren't achievable. Increase MDE to detect only larger improvements—if your monthly traffic only supports detecting 20% relative improvements reliably, focus testing on changes with potential for that magnitude of impact rather than attempting to detect subtle 5% improvements requiring impractically large samples. Concentrate testing on highest-traffic pages and funnel stages where sample accumulates most quickly—homepage and primary landing pages typically accumulate sufficient samples faster than deep funnel pages. Extend test duration to accumulate required samples over months rather than weeks for important tests. Consider user experience research methods (session recordings, user testing, exit surveys) for lower-traffic pages where statistical testing isn't feasible—qualitative methods provide actionable insights without statistical sample requirements. Accept that testing programmes for traffic-constrained businesses necessarily produce fewer tests than high-traffic equivalents—prioritise ruthlessly to maximise impact of limited testing capacity.
What should Australian businesses do when A/B test results show a winning variant for overall conversion rate but negative effects for specific important segments?
Segment-specific negative results despite positive overall outcomes require careful implementation decisions that aggregate results alone don't resolve. Assess the commercial importance of negatively affected segments—if mobile visitors (representing 70% of traffic) show negative results whilst desktop visitors (30%) drive positive aggregate outcomes, the aggregate result misleads. Calculate segment-specific revenue impact by combining segment-specific conversion rates with segment traffic volumes and average order values—the segment where revenue impact is largest should dominate implementation decisions when segments diverge. Consider segment-specific implementation where technically feasible—showing winning variant to desktop visitors whilst maintaining control for mobile visitors delivers positive results for benefiting segments without harming negatively affected ones. Never implement based solely on aggregate results when meaningful segments show statistically significant negative impacts—the aggregate conceals real harm to specific valuable visitor groups.
How do Australian businesses distinguish between true A/B test wins that will sustain long-term versus temporary novelty effects that fade after initial implementation?
Distinguishing genuine improvements from novelty effects requires post-implementation monitoring rather than relying solely on test results. After implementing test winners, monitor conversion rates for four to eight weeks post-implementation—genuine improvements typically sustain or improve as implementation refinements are made, whilst novelty effects show characteristic decline from initial implementation spike back toward baseline. Compare implemented winner performance against pre-test baseline rather than against test period performance—this comparison controls for any external factors affecting conversion rates during the test period. For high-stakes implementations, consider extended testing periods of six to eight weeks before declaring conclusive results—tests running longer are more likely to outlast novelty effects before results are analysed. Historically tracking novelty effect patterns across your specific testing programme builds institutional knowledge about how quickly novelty fades for your specific audience, informing minimum test duration requirements for future experiments.
How should Australian businesses structure their A/B testing roadmap across a full year to maximise cumulative conversion improvements?
Annual testing roadmaps balance strategic coverage across the customer journey with realistic capacity constraints and seasonal considerations. Begin with highest-impact, highest-confidence opportunities from the hypothesis backlog—early wins build organisational confidence in testing whilst generating immediate revenue returns justifying continued investment. Allocate testing capacity across funnel stages throughout the year—spending the entire year testing only homepage elements neglects high-impact opportunities in checkout, product pages, and lead generation forms where improvements also compound. Schedule testing pauses around major business disruptions (peak trading periods, major site migrations, significant campaign launches) when atypical behaviour contaminates results. Build in analysis and implementation time between tests rather than immediately launching subsequent experiments—rushing from test to test without adequate implementation and stabilisation time produces overlapping experiments that corrupt each other's statistical validity. Review roadmap quarterly against actual results—consistently negative or inconclusive tests in specific areas might suggest moving testing investment toward more fertile optimisation opportunities rather than persisting with unproductive hypotheses.
What are the ethical considerations for A/B testing that Australian businesses should understand, particularly regarding testing on vulnerable populations or using deceptive practices?
A/B testing ethics are increasingly important for Australian businesses operating under both legal obligations and community expectations regarding fair treatment of consumers. Deceptive testing practices that deliberately mislead users—presenting false urgency (fake countdown timers), false scarcity (inaccurate stock indicators), or manipulative social proof (fabricated review counts)—are both ethically problematic and increasingly subject to Australian Consumer Law enforcement. Tests should never involve illegal discrimination testing whether conversion rates differ when presenting different prices, offers, or service levels to users based on protected characteristics including race, gender, or disability. Vulnerable population considerations apply to businesses serving older Australians, people experiencing financial hardship, or users with cognitive impairments—testing designed to exploit these vulnerabilities rather than improve genuine user experience violates both ethical standards and consumer protection frameworks. Transparent privacy disclosures should cover A/B testing data collection in privacy policies, ensuring users understand that their experiences may vary as part of ongoing optimisation programmes. Ethical A/B testing improves genuine user experience through evidence-based optimisation—it doesn't manipulate users into conversion through deceptive practices that undermine trust when discovered.
Statistical Rigour Transforms Testing Outcomes
A/B testing framework built on statistical foundations transforms conversion optimisation from expensive guesswork into systematic, reliable improvement that compounds into significant commercial advantage for Australian businesses committed to evidence-based decision-making.
The frameworks outlined in this guide—statistical significance requirements, proper sample size calculation, structured hypothesis development, disciplined test execution, and rigorous result interpretation—provide comprehensive foundation for testing programmes that produce genuine conversion improvements rather than false confidence from statistically invalid results.
Australian businesses implementing statistically rigorous testing consistently discover that fewer, better-designed tests produce more reliable improvements than high-velocity programmes that generate noise—and that the discipline of proper statistical practice ultimately compounds into substantially better conversion performance than intuition-based changes, however confidently executed.
Ready to implement a statistically rigorous A/B testing framework that produces reliable conversion improvements for your Australian business? Maven Marketing Co. provides comprehensive conversion optimisation services including testing strategy, statistical framework implementation, hypothesis development, and result interpretation ensuring your testing programme generates genuine, sustainable conversion improvements. Let's build testing discipline that transforms your optimisation programme into a reliable conversion improvement engine.

Table of contents
read more blogs

Handing the Keys to Google's AI: How to Keep Control of Your Ad Budget Inside Performance Max
Performance Max is Google's most automated campaign type, and also the one that provokes the most anxiety among Australian advertisers who have spent years developing campaign management practices that depend on visibility, control, and the ability to make deliberate, measurable changes. The anxiety has some basis. Performance Max does take more control away from the advertiser than any previous Google Ads campaign type: it chooses the placements, it selects the creative combinations, it determines the bid for each impression, and it distributes the budget across Google's inventory in ways the advertiser cannot directly specify. The part of the anxiety that is not well based is the conclusion that these constraints make Performance Max unmanageable or a blank cheque handed to Google's algorithm. Performance Max has a specific set of levers that, when correctly configured, give advertisers meaningful influence over where the budget goes, which audiences it targets, which creative assets it uses, and which conversion events it optimises toward. Understanding and using these levers is the difference between a Performance Max campaign that works within the advertiser's strategic parameters and one that wastes budget on inventory, audiences, and objectives that the business never intended to pursue.

When Customers Search on TikTok and Instagram Instead of Google — How Australian Brands Adapt
Something structurally significant has changed in how younger Australian consumers research purchases, and most Australian brands have not yet adjusted their discoverability strategy to reflect it. A proportion of the audience that would previously have opened Google to search for "best brunch spots Fitzroy" or "honest review Mecca skincare serum" is now opening TikTok or Instagram instead. They are searching within these platforms for short video content that shows them what they want to know: the actual food, the actual product, the actual experience, from people who have actually been there or used the item. This is not a marginal behaviour limited to a niche demographic. TikTok's own data has reported that a significant share of its users use the platform as a search engine, and the query patterns on Instagram's search function have expanded well beyond celebrity and hashtag discovery into product, venue, and service research. For Australian brands that have built their discoverability strategy entirely on Google organic search and Google Ads, this shift represents a gap that is growing over time as the audience that uses social platforms as primary discovery tools ages into demographics with higher purchasing power. This article covers what the shift to social search means practically, what content and account configuration signals these platforms use to surface results, and what Australian brands need to do differently to be found on TikTok and Instagram by people who are actively looking for what they offer.

How to Build a Google Business Profile That Converts Browsers Into Booked Appointments
A Google Business Profile that has been set up and left alone is doing roughly the same work as a shop front with the lights off. It confirms the business exists and provides the phone number, but it is not actively persuading a local searcher who is comparing three businesses in the search results to choose this one rather than the competitors sitting directly above and below it in the local pack. The businesses that win appointments from Google local search are not simply those that are closest to the searcher or those with the most reviews, although proximity and reviews both matter. They are the businesses that have treated their Google Business Profile as a conversion surface rather than a directory entry, and have populated every element of the profile with the specific information, imagery, and social proof that a local searcher needs to make a confident decision to book rather than keep browsing. The difference between a profile that ranks and converts and one that ranks but loses its potential customers to competitors is in the specific decisions this article covers: how to write the business description, which photos produce engagement, how to use posts to maintain freshness signals, how to respond to reviews in a way that builds rather than diminishes trust, and how to configure the booking and contact features that reduce friction between intent and appointment.


