.svg)
.svg)
.svg)


%201.svg)

Quick Answers
Q: How much does website speed actually impact conversion rates and revenue?
Website speed has a direct, measurable impact on conversion rates and revenue that most businesses underestimate. Google research found that as page load time increases from one second to three seconds, bounce probability increases 32%. From one to five seconds, bounce probability increases 90%. From one to ten seconds, it increases 123%. Amazon famously calculated that every 100ms of latency costs them 1% in sales. For e-commerce sites, a one second page delay typically reduces conversions by 7%, page views by 11%, and customer satisfaction by 16%. When you calculate the impact for your business, multiply your current traffic by your conversion rate decrease at slower speeds, then multiply by average order value. A site generating $100,000 monthly with 50,000 visitors and a 2% conversion rate could lose $7,000 monthly from a one second slowdown. The ROI of speed optimization becomes immediately clear when you quantify these losses.
Q: What website speed metrics should Australian businesses prioritize to improve performance and SEO?
Australian businesses should focus on Core Web Vitals, Google's official metrics for measuring user experience: Largest Contentful Paint (LCP) measures loading performance and should occur within 2.5 seconds, First Input Delay (FID) measures interactivity and should be less than 100 milliseconds, and Cumulative Layout Shift (CLS) measures visual stability and should be less than 0.1. Beyond Core Web Vitals, monitor Time to First Byte (TTFB) which should be under 600ms, First Contentful Paint (FCP) under 1.8 seconds, and total page load time under 3 seconds for mobile. For Australian businesses targeting local markets, test from Australian servers using tools like GTmetrix, Google PageSpeed Insights, and WebPageTest with Sydney or Melbourne test locations. Mobile speed deserves particular attention as 70% of Australian web traffic comes from mobile devices. Prioritize optimizing these metrics in order: LCP first for immediate user perception improvements, then FID for interaction responsiveness, finally CLS for visual stability.
Your website loads in five seconds. Not bad, right? Wrong. In those five seconds, you've already lost half your potential customers. They've hit the back button, moved to a competitor, and you'll never even know they visited.
Website speed isn't a technical detail for developers to worry about. It's a revenue issue that belongs in every boardroom discussion about digital strategy. Yet most Australian businesses have no idea how much money slow websites cost them every single day.
Let's fix that with cold, hard data.
.avif)
The Psychology of Speed: Why Milliseconds Matter
Human perception of time online differs dramatically from the physical world. When we click a link, our brains expect near-instantaneous response. Research shows that users form opinions about website credibility within 50 milliseconds of landing on a page. Within three seconds, the majority decide whether to stay or leave.
This isn't about impatience. It's about abundance. Your potential customers have unlimited alternatives just one click away. Every moment your site takes to load is a moment they're questioning whether to wait or find someone else who respects their time.
The psychological impact compounds:
- Trust erosion: Slow sites signal outdated technology, poor business practices, or lack of professionalism
- Frustration amplification: Each additional second of waiting feels exponentially longer than the previous one
- Credibility damage: Users associate site speed with business competence and reliability
- Mobile impatience: Mobile users expect even faster experiences as they're often on-the-go with limited attention
Australian consumers particularly value efficiency. In a market where quality service defines competitive advantage, your website speed becomes an extension of your brand promise.
The Data: Quantifying How Speed Impacts Your Bottom Line
Let's examine the research that should terrify any business owner with a slow website:
Conversion Rate Impact
Multiple studies demonstrate consistent conversion rate drops as load time increases:
Google Research Findings:
- 1 to 3 seconds: Bounce probability increases 32%
- 1 to 5 seconds: Bounce probability increases 90%
- 1 to 6 seconds: Bounce probability increases 106%
- 1 to 10 seconds: Bounce probability increases 123%
Portent's 2022 Analysis of website conversion rates across industries found:
- Sites loading in 1 second: 3.05% average conversion rate
- Sites loading in 2 seconds: 1.68% conversion rate (45% decrease)
- Sites loading in 3 seconds: 1.12% conversion rate (63% decrease)
- Sites loading in 5 seconds: 0.67% conversion rate (78% decrease)
.avif)
For Australian e-commerce businesses, this translates directly to lost revenue. A site with 10,000 monthly visitors, $100 average order value, and a baseline 2% conversion rate at two second load time generates $20,000 monthly. If that site slows to five seconds, conversion drops to approximately 0.67%, generating only $6,700. That's a $13,300 monthly loss, or $159,600 annually.
Mobile Commerce Reality
Mobile speed matters even more as mobile commerce dominates the Australian market:
- 53% of mobile users abandon sites taking longer than 3 seconds to load
- 70% of mobile pages take longer than 5 seconds to load
- Mobile conversions drop 20% for every additional second of load time
- 79% of shoppers who experience site performance issues are less likely to purchase from that site again
With mobile traffic representing 60% to 70% of total web traffic for most Australian businesses, mobile speed optimization directly impacts the majority of your potential revenue.
SEO and Organic Traffic Impact
Google has made page speed a ranking factor for both desktop (since 2010) and mobile searches (since 2018). The introduction of Core Web Vitals in 2021 made speed even more critical to search visibility.
SEO Performance Data:
- Pages loading in under 3 seconds rank higher than slower pages in 70% of cases
- Improving Core Web Vitals can increase organic traffic by 10% to 30%
- Mobile-first indexing means mobile speed determines your ranking for all searches
- Faster sites get crawled more frequently, helping new content rank faster
For businesses depending on organic search (most Australian SMBs), speed improvements deliver compounding returns. Better rankings drive more traffic, which generates more conversions, which justifies further investment in digital presence.
Brand Perception and Customer Lifetime Value
Speed affects more than immediate conversions. It shapes long-term customer relationships:
- 79% of customers who experience poor site performance say they're less likely to purchase from that site again
- 44% of users tell friends about poor website experiences
- Companies with fast sites report 70% longer average session durations
- Page views per session increase 35% when load time improves from 8 seconds to 2 seconds
Customer lifetime value calculations must factor in the reality that slow sites damage acquisition and retention simultaneously. You're not just losing one sale but potential repeat business and referrals.
Calculating Your Website Speed ROI
Most businesses know their site is "kind of slow" but have no framework for quantifying what that costs. Here's how to calculate your speed ROI:

Step 1: Establish Your Current Performance Baseline
Test your current site speed using multiple tools:
Google PageSpeed Insights: Provides Core Web Vitals scores and specific recommendations (https://pagespeed.web.dev)GTmetrix: Detailed performance analysis with Australian server testing optionsWebPageTest: Advanced testing with Sydney and Melbourne locations for local performance measurement
Record these baseline metrics:
- Total page load time (mobile and desktop)
- Largest Contentful Paint (LCP)
- First Input Delay (FID)
- Cumulative Layout Shift (CLS)
- Time to First Byte (TTFB)
Step 2: Calculate Current Performance Impact
Use your analytics to establish:
- Monthly traffic volume
- Current conversion rate
- Average order value (e-commerce) or lead value (services)
- Current bounce rate
- Average session duration
Step 3: Project Improvement Impact
Based on research benchmarks, calculate potential improvements:
Conversion Rate Improvement Formula:Current monthly revenue × (projected conversion rate increase percentage) = monthly revenue gain
Example Calculation:
- Current traffic: 20,000 monthly visitors
- Current load time: 5 seconds
- Current conversion rate: 1.2%
- Average order value: $150
- Current monthly revenue: $36,000
After optimization to 2 seconds:
- Projected conversion rate: 2.4% (conservative estimate based on research)
- Projected monthly revenue: $72,000
- Monthly revenue gain: $36,000
- Annual revenue gain: $432,000
Optimization investment: $15,000 to $30,000ROI: 1,440% to 2,880% annually
Even with conservative estimates assuming only 50% of research benchmarks apply to your business, ROI remains exceptional.
Step 4: Factor in SEO and Lifetime Value
Speed improvements deliver benefits beyond immediate conversion increases:
Organic Traffic Growth:Conservative estimate: 10% traffic increase from improved rankings20,000 visitors × 10% = 2,000 additional monthly visitors2,000 visitors × 2.4% conversion × $150 = $7,200 additional monthly revenue
Reduced Bounce Rate:Lower bounce rates improve Quality Score for paid ads, reducing CPC by 5% to 15%
Improved Customer Retention:Faster experiences increase repeat purchase probability by 15% to 25%
These compounding effects make speed optimization one of the highest ROI digital investments available.
Real World Case Studies: Speed Optimization Success Stories

Global E-Commerce Platform
An international fashion retailer reduced page load time from 6.5 seconds to 2.3 seconds through comprehensive optimization. Results measured over six months:
- Conversion rate increased 28%
- Revenue per visitor increased 32%
- Bounce rate decreased 41%
- Organic traffic increased 19%
- Mobile conversions increased 43%
Estimated annual revenue impact: $12.7 million on a $45 million annual revenue base.
Australian Financial Services Company
A Melbourne-based financial services firm optimized their comparison tools and application forms, reducing load time from 4.8 seconds to 1.9 seconds:
- Lead generation increased 31%
- Form completion rates improved 27%
- Cost per acquisition decreased 23%
- Mobile lead submissions increased 52%
The optimization investment of $22,000 generated an additional $340,000 in first-year revenue from improved conversion rates alone.
SaaS Platform Performance Overhaul
A Sydney-based SaaS company rebuilt their frontend architecture using modern performance optimization techniques, reducing initial load from 7.2 seconds to 2.1 seconds:
- Free trial signups increased 37%
- Trial-to-paid conversion improved 24%
- User session duration increased 48%
- Monthly recurring revenue growth accelerated 29%
The technical investment paid for itself within 2.3 months through improved conversion metrics.
Content Publisher Mobile Optimization
An Australian news publisher prioritized mobile speed optimization after recognizing 75% of traffic came from mobile devices. Load time improved from 8.3 seconds to 2.7 seconds:
- Mobile bounce rate decreased 38%
- Pages per session increased 41%
- Ad revenue per visitor increased 33%
- Return visitor rate increased 26%
Annual ad revenue increased by $890,000 with ongoing optimization costs of approximately $60,000 annually.
The Cost of Ignoring Speed
While optimization delivers measurable returns, inaction carries quantifiable costs:
Competitive Disadvantage
Your competitors are optimizing. According to HTTP Archive data, median page load times have decreased 35% over the past three years as businesses prioritize performance. If your site hasn't improved, you're falling behind the market standard.
Customers compare experiences. When a competitor's site loads in two seconds and yours takes six, they've already formed opinions about which business is more professional and trustworthy.
Compounding SEO Losses
Google's algorithm updates increasingly prioritize user experience signals, with Core Web Vitals becoming table stakes for competitive rankings. Sites that fail to optimize face:
- Gradual ranking decreases as competitors improve
- Reduced crawl frequency, slowing indexation of new content
- Lower Quality Scores affecting paid search performance
- Decreased featured snippet and position zero opportunities
These SEO losses compound monthly, making recovery increasingly expensive.
Mobile Market Share Erosion
Mobile commerce continues growing. Australian mobile commerce reached $16.7 billion in 2023, representing 45% of total e-commerce. Businesses with poor mobile experiences lose market share to mobile-optimized competitors permanently.
First impressions matter. Users who have poor mobile experiences rarely return, even if you optimize later.
Critical Website Speed Metrics Explained
Understanding which metrics matter helps prioritize optimization efforts:
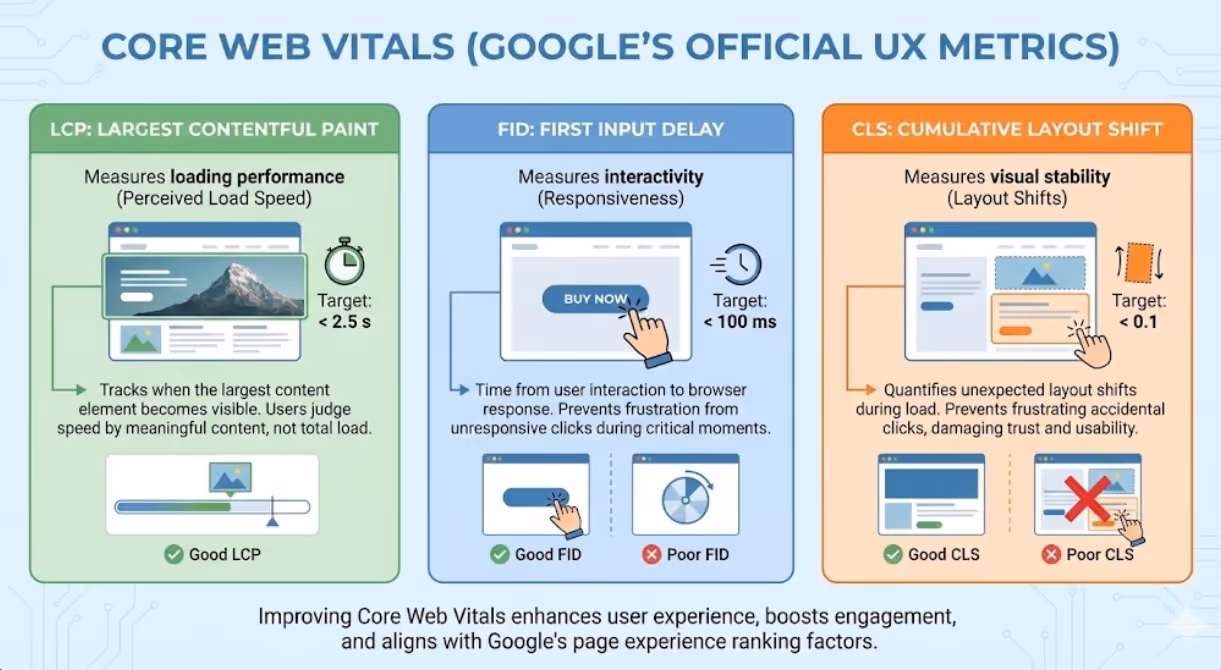
Core Web Vitals (Google's Official UX Metrics)
Largest Contentful Paint (LCP): Measures loading performance by tracking when the largest content element becomes visible. Target: under 2.5 seconds.
Why It Matters: LCP represents perceived load speed better than total page load. Users judge your site's speed by when meaningful content appears, not when every resource finishes downloading.
First Input Delay (FID): Measures interactivity by tracking the time from when a user first interacts with your page to when the browser responds. Target: under 100 milliseconds.
Why It Matters: Nothing frustrates users more than clicking buttons that don't respond. FID quantifies responsiveness during the most critical interaction period.
Cumulative Layout Shift (CLS): Measures visual stability by quantifying unexpected layout shifts during page load. Target: under 0.1.
Why It Matters: Have you ever tried clicking a button, only to have it move as an image loads, causing you to click something else? CLS measures these frustrating experiences that damage trust and usability.
Additional Performance Metrics
Time to First Byte (TTFB): Measures server response time. Target: under 600ms.
Fast TTFB indicates efficient server processing and hosting infrastructure. Slow TTFB suggests server-side bottlenecks requiring optimization.
First Contentful Paint (FCP): Measures when the first content element renders. Target: under 1.8 seconds.
FCP represents the moment users first see something, reducing perceived wait time even before full content loads.
Speed Index: Measures how quickly content is visually displayed during page load. Lower is better.
Speed Index provides a holistic view of perceived performance throughout the loading process.
Mobile-Specific Considerations
Mobile metrics deserve separate attention:
- Test on real devices, not just simulators
- Consider varying network conditions (3G, 4G, 5G)
- Factor in CPU limitations of mid-range devices
- Account for Australian mobile network performance variations
Most users don't have the latest flagship phones on perfect network connections. Optimize for real-world conditions.
Proven Strategies for Optimizing Website Speed
Now that you understand the ROI, here's how to capture it:
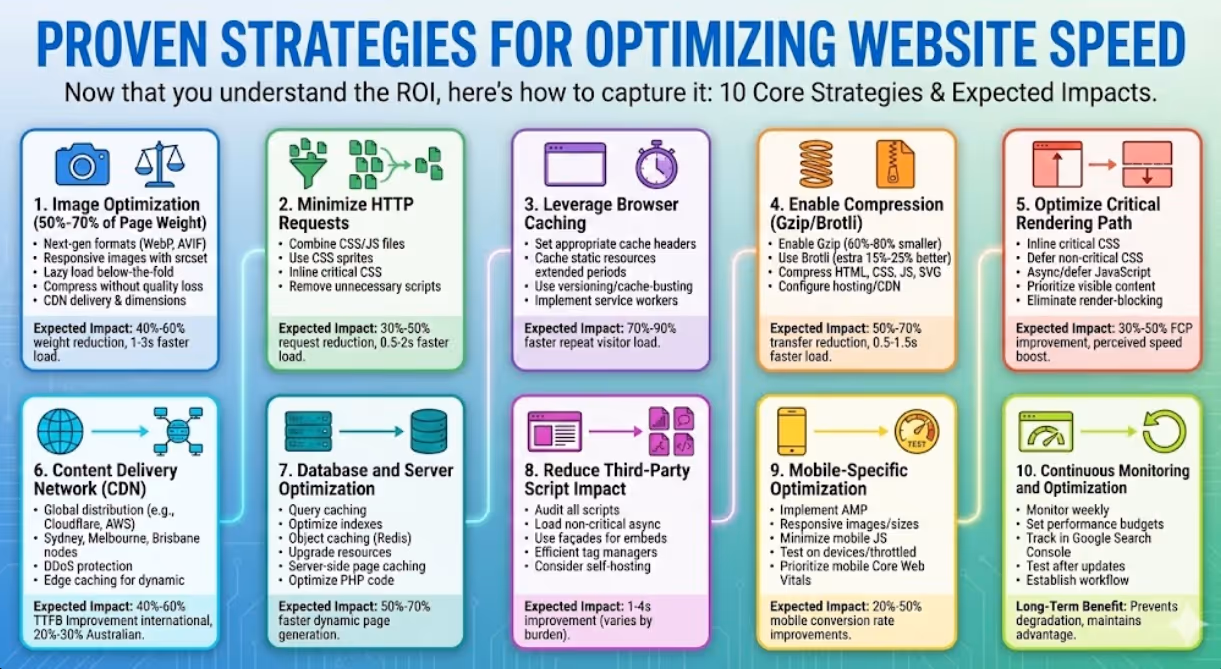
1. Image Optimization (Often 50% to 70% of Page Weight)
Images represent the largest opportunity for quick wins:
Implementation Tactics:
- Use next-generation formats (WebP, AVIF) with fallbacks
- Implement responsive images with srcset attributes
- Lazy load below-the-fold images
- Compress images without quality loss (tools like ImageOptim, TinyPNG)
- Use CDN delivery for faster geographic distribution
- Set appropriate dimensions to avoid browser resizing
Expected Impact: 40% to 60% reduction in page weight, 1 to 3 second improvement in load time.
2. Minimize HTTP Requests
Every resource (CSS file, JavaScript file, image, font) requires a separate server request. Reducing requests accelerates loading:
Optimization Methods:
- Combine CSS files into single stylesheets
- Bundle JavaScript into fewer files
- Use CSS sprites for small images and icons
- Inline critical CSS for above-the-fold content
- Remove unnecessary third-party scripts
Expected Impact: 30% to 50% reduction in total requests, 0.5 to 2 second improvement.
3. Leverage Browser Caching
Caching stores website resources locally so returning visitors load pages instantly:
Configuration Steps:
- Set appropriate cache headers (Expires, Cache-Control)
- Cache static resources for extended periods (images, CSS, JavaScript)
- Use versioning or cache-busting for updated resources
- Implement service workers for advanced caching strategies
Expected Impact: Repeat visitor load time improvement of 70% to 90%.
4. Enable Compression
Gzip and Brotli compression reduce file sizes before transmission:
Implementation:
- Enable Gzip compression on your server (reduces file size by 60% to 80%)
- Use Brotli compression for even better results (additional 15% to 25% improvement)
- Compress HTML, CSS, JavaScript, and SVG files
- Configure compression in your hosting environment or CDN
Expected Impact: 50% to 70% reduction in transferred data, 0.5 to 1.5 second improvement.
5. Optimize Critical Rendering Path
Prioritize loading resources needed for above-the-fold content:
Techniques:
- Inline critical CSS for immediate rendering
- Defer non-critical CSS loading
- Async or defer JavaScript loading
- Prioritize visible content in HTML structure
- Eliminate render-blocking resources
Expected Impact: FCP improvement of 30% to 50%, perceived speed increase significantly higher.
6. Content Delivery Network (CDN) Implementation
CDNs distribute your content across global servers, delivering from locations nearest to users:
Australian Benefits:
- Sydney, Melbourne, and Brisbane CDN nodes serve local traffic faster
- Reduces server load on origin infrastructure
- Provides DDoS protection and security benefits
- Enables edge caching for dynamic content
Recommended Providers: Cloudflare, AWS CloudFront, Fastly, Azure CDN
Expected Impact: 40% to 60% TTFB improvement for international visitors, 20% to 30% for Australian users.
7. Database and Server Optimization
Backend performance determines TTFB and dynamic content generation speed:
Optimization Areas:
- Implement database query caching
- Optimize database indexes
- Use object caching (Redis, Memcached)
- Upgrade server resources if bottlenecked
- Implement server-side page caching
- Optimize PHP/server-side code efficiency
Expected Impact: 50% to 70% reduction in dynamic page generation time.
8. Reduce Third-Party Script Impact
Third-party scripts (analytics, chat widgets, ads, social media) often cause the biggest performance problems:
Management Strategies:
- Audit all third-party scripts for necessity
- Load non-critical scripts asynchronously
- Use façades for resource-heavy embeds (YouTube, Google Maps)
- Implement tag managers efficiently
- Consider self-hosting critical scripts
Expected Impact: 1 to 4 second improvement depending on current third-party burden.
9. Mobile-Specific Optimization
Mobile optimization requires additional considerations:
Mobile-First Techniques:
- Implement Accelerated Mobile Pages (AMP) for content
- Use responsive images with appropriate sizes
- Minimize mobile JavaScript complexity
- Test on actual mobile devices and throttled connections
- Prioritize mobile Core Web Vitals
Expected Impact: Mobile conversion rate improvements of 20% to 50%.
10. Continuous Monitoring and Optimization
Speed optimization isn't a one-time project:
Ongoing Process:
- Monitor performance weekly using automated tools
- Set up performance budgets preventing regression
- Track Core Web Vitals in Google Search Console
- Test after every major update or addition
- Establish performance as part of development workflow
Long-Term Benefit: Prevents performance degradation and maintains competitive advantage.
Common Speed Optimization Mistakes to Avoid
Even well-intentioned optimization efforts can backfire:

Over-Optimization at the Expense of Functionality
Don't sacrifice conversion-critical elements for speed scores. Analytics, chat support, and payment processing may add milliseconds but drive revenue. Balance optimization with business needs.
Focusing Only on Homepage Speed
Users land on product pages, blog posts, and category pages. Optimize your entire site, not just the homepage that represents a fraction of traffic.
Ignoring Real-World Conditions
Testing on fast computers with fiber internet doesn't represent your actual users. Test on mid-range mobile devices with typical Australian mobile network conditions.
Setting Unrealistic Expectations
Some sites (particularly e-commerce with complex functionality) will never achieve perfect performance scores. Focus on meaningful improvements over perfect scores.
Neglecting Mobile Performance
With 70% of traffic coming from mobile devices, mobile speed should be your primary focus, not an afterthought.
Implementation: Getting Started with Speed Optimization
Ready to capture the ROI of website speed? Here's your implementation roadmap:
Phase 1: Assessment and Baseline (Week 1)
Activities:
- Test current performance using multiple tools
- Identify biggest bottlenecks (images, scripts, server response)
- Document current conversion rates and bounce rates
- Calculate current performance cost using ROI formulas
- Set realistic performance targets
Phase 2: Quick Wins (Weeks 2 to 4)
Priorities:
- Optimize and compress images
- Enable compression and caching
- Remove unnecessary scripts
- Implement CDN for static resources
Expected Results: 30% to 50% improvement in load time with minimal investment.
Phase 3: Technical Optimization (Weeks 5 to 8)
Advanced Work:
- Optimize critical rendering path
- Implement lazy loading
- Database and server optimization
- Mobile-specific improvements
- Third-party script management
Expected Results: Additional 20% to 40% improvement reaching target performance.
Phase 4: Monitoring and Iteration (Ongoing)
Continuous Improvement:
- Set up automated monitoring
- Establish performance budgets
- Regular testing and optimization
- Track conversion and revenue impact
- Document ROI for stakeholders
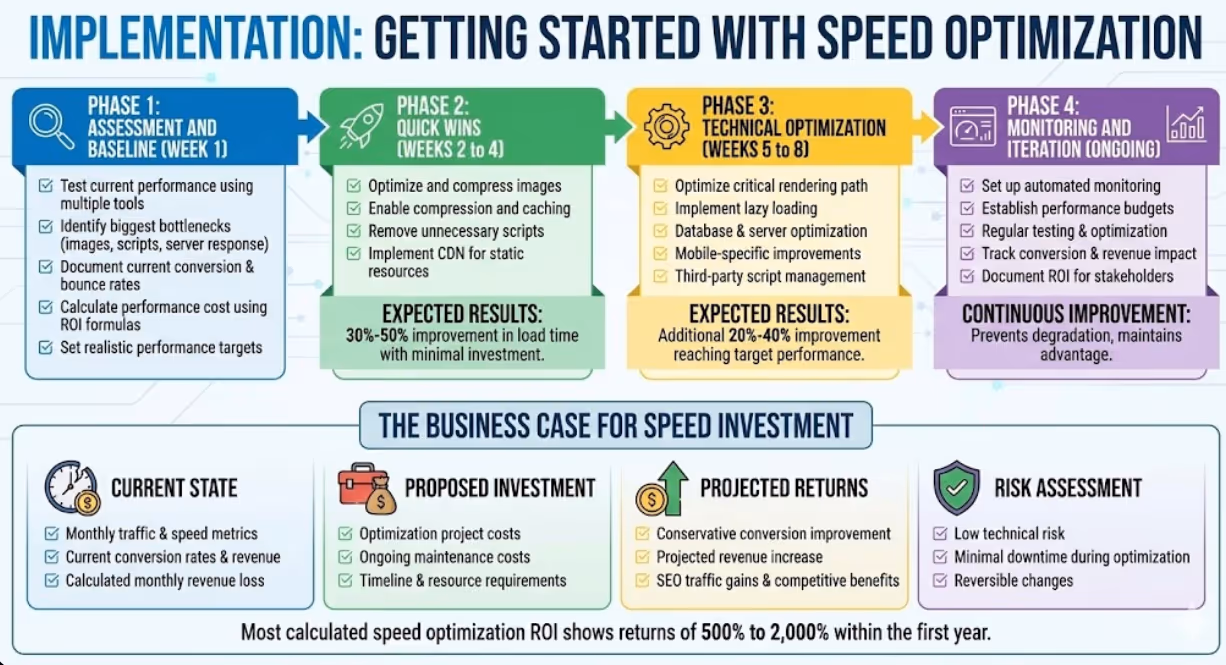
The Business Case for Speed Investment
When presenting speed optimization to stakeholders, focus on business outcomes:
ROI Presentation Framework:
Current State:
- Monthly traffic and current speed metrics
- Current conversion rates and revenue
- Calculated monthly revenue loss from poor performance
Proposed Investment:
- Optimization project costs
- Ongoing maintenance costs
- Timeline and resource requirements
Projected Returns:
- Conservative conversion rate improvement
- Projected revenue increase
- SEO traffic gains
- Competitive positioning benefits
- Customer experience improvements
Risk Assessment:
- Low technical risk with proper implementation
- Minimal downtime during optimization
- Reversible changes if issues arise
Most properly calculated speed optimization ROI calculations show returns of 500% to 2,000% within the first year.
Ready to Stop Losing Revenue to Slow Website Speed?
Every day you delay optimizing your website speed is another day of lost customers and revenue. The data is clear: faster websites convert better, rank higher, and generate more revenue per visitor.
For Australian businesses competing in increasingly digital markets, website speed optimization delivers measurable ROI that few other digital investments can match. Whether you're an e-commerce business losing transactions to slow checkout experiences, a service provider struggling with mobile lead generation, or a content publisher watching visitors bounce from sluggish pages, speed optimization transforms your bottom line.
The question isn't whether to optimize. It's how quickly you can implement improvements and start capturing the revenue currently walking out your digital door.
Ready to calculate your website speed ROI and implement optimization strategies? Maven Marketing Co. specializes in performance optimization that delivers measurable business results. Our team conducts comprehensive speed audits, identifies specific bottlenecks costing you revenue, and implements proven optimization strategies tailored to Australian businesses.
We don't just improve speed scores. We improve conversion rates, organic rankings, and revenue per visitor through data-driven performance optimization.
Contact Maven Marketing Co. today for a complimentary website speed audit. We'll analyze your current performance, calculate exactly how much slow speed is costing your business, and provide a detailed roadmap for optimization with projected ROI. Let's turn your website speed from a liability into a competitive advantage that drives measurable revenue growth.
Stop losing customers to slow load times. Every second counts, and every second costs you money. Start optimizing today and watch your conversion rates, search rankings, and revenue climb as your load times drop. The ROI is waiting.

Table of contents
read more blogs

Handing the Keys to Google's AI: How to Keep Control of Your Ad Budget Inside Performance Max
Performance Max is Google's most automated campaign type, and also the one that provokes the most anxiety among Australian advertisers who have spent years developing campaign management practices that depend on visibility, control, and the ability to make deliberate, measurable changes. The anxiety has some basis. Performance Max does take more control away from the advertiser than any previous Google Ads campaign type: it chooses the placements, it selects the creative combinations, it determines the bid for each impression, and it distributes the budget across Google's inventory in ways the advertiser cannot directly specify. The part of the anxiety that is not well based is the conclusion that these constraints make Performance Max unmanageable or a blank cheque handed to Google's algorithm. Performance Max has a specific set of levers that, when correctly configured, give advertisers meaningful influence over where the budget goes, which audiences it targets, which creative assets it uses, and which conversion events it optimises toward. Understanding and using these levers is the difference between a Performance Max campaign that works within the advertiser's strategic parameters and one that wastes budget on inventory, audiences, and objectives that the business never intended to pursue.

When Customers Search on TikTok and Instagram Instead of Google — How Australian Brands Adapt
Something structurally significant has changed in how younger Australian consumers research purchases, and most Australian brands have not yet adjusted their discoverability strategy to reflect it. A proportion of the audience that would previously have opened Google to search for "best brunch spots Fitzroy" or "honest review Mecca skincare serum" is now opening TikTok or Instagram instead. They are searching within these platforms for short video content that shows them what they want to know: the actual food, the actual product, the actual experience, from people who have actually been there or used the item. This is not a marginal behaviour limited to a niche demographic. TikTok's own data has reported that a significant share of its users use the platform as a search engine, and the query patterns on Instagram's search function have expanded well beyond celebrity and hashtag discovery into product, venue, and service research. For Australian brands that have built their discoverability strategy entirely on Google organic search and Google Ads, this shift represents a gap that is growing over time as the audience that uses social platforms as primary discovery tools ages into demographics with higher purchasing power. This article covers what the shift to social search means practically, what content and account configuration signals these platforms use to surface results, and what Australian brands need to do differently to be found on TikTok and Instagram by people who are actively looking for what they offer.

How to Build a Google Business Profile That Converts Browsers Into Booked Appointments
A Google Business Profile that has been set up and left alone is doing roughly the same work as a shop front with the lights off. It confirms the business exists and provides the phone number, but it is not actively persuading a local searcher who is comparing three businesses in the search results to choose this one rather than the competitors sitting directly above and below it in the local pack. The businesses that win appointments from Google local search are not simply those that are closest to the searcher or those with the most reviews, although proximity and reviews both matter. They are the businesses that have treated their Google Business Profile as a conversion surface rather than a directory entry, and have populated every element of the profile with the specific information, imagery, and social proof that a local searcher needs to make a confident decision to book rather than keep browsing. The difference between a profile that ranks and converts and one that ranks but loses its potential customers to competitors is in the specific decisions this article covers: how to write the business description, which photos produce engagement, how to use posts to maintain freshness signals, how to respond to reviews in a way that builds rather than diminishes trust, and how to configure the booking and contact features that reduce friction between intent and appointment.


