.svg)
.svg)
.svg)


%201.svg)

Key Takeaways
- The slow query log is the correct starting point for SQL query optimisation work on a production database. It identifies the specific queries consuming the most time rather than requiring the developer to guess where performance problems exist.
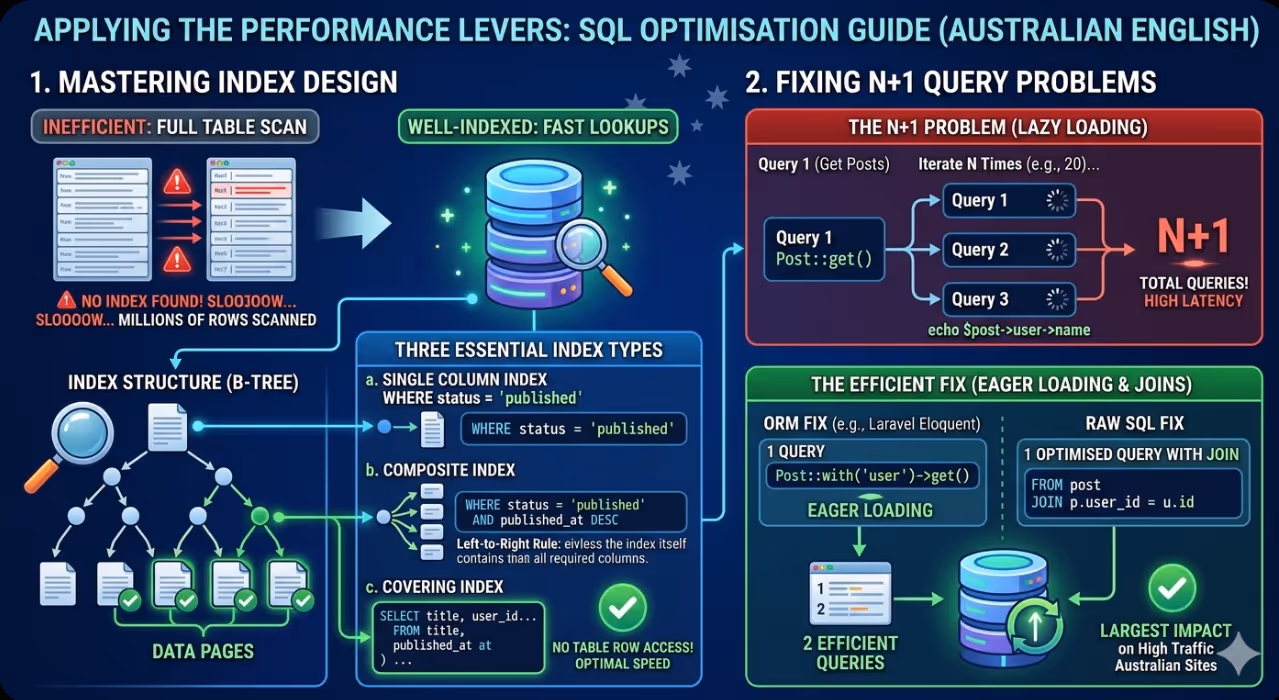
- Index design is the intervention with the single greatest impact in most database performance investigations. A query performing a full table scan on a table with millions of rows can be transformed into a operation that completes in under a millisecond by adding an appropriate index on the columns in the WHERE and JOIN clauses.
- The EXPLAIN statement (or EXPLAIN ANALYZE in PostgreSQL) is the essential diagnostic tool for understanding why a query is slow. Reading the execution plan it produces reveals whether the query is using indexes, how many rows are being scanned, and where the most expensive operations are occurring.
- N+1 query problems are among the most destructive database performance issues in web applications because they generate query counts that scale with data volume rather than remaining constant. A page that makes one query to retrieve ten blog posts and then ten additional queries to retrieve the author for each post has an N+1 problem that will worsen as the post count grows.
- Query result caching at the application level, using tools such as Redis or Memcached, is the appropriate strategy for queries that are expensive to execute and whose results change infrequently. Caching does not fix a poorly optimised query but it reduces the frequency at which the database must execute it.
- Schema design decisions made during application development have lasting performance implications. Column data types, normalisation choices, and the presence or absence of foreign key constraints all affect query performance in ways that become increasingly significant as data volume grows.
- Database performance optimisation is iterative. Fixing the slowest query in the system typically reveals the next slowest, and the process of profiling, diagnosing, fixing, and profiling again should be repeated until the remaining query times are within acceptable thresholds for the site's performance requirements.
Starting With the Slow Query Log
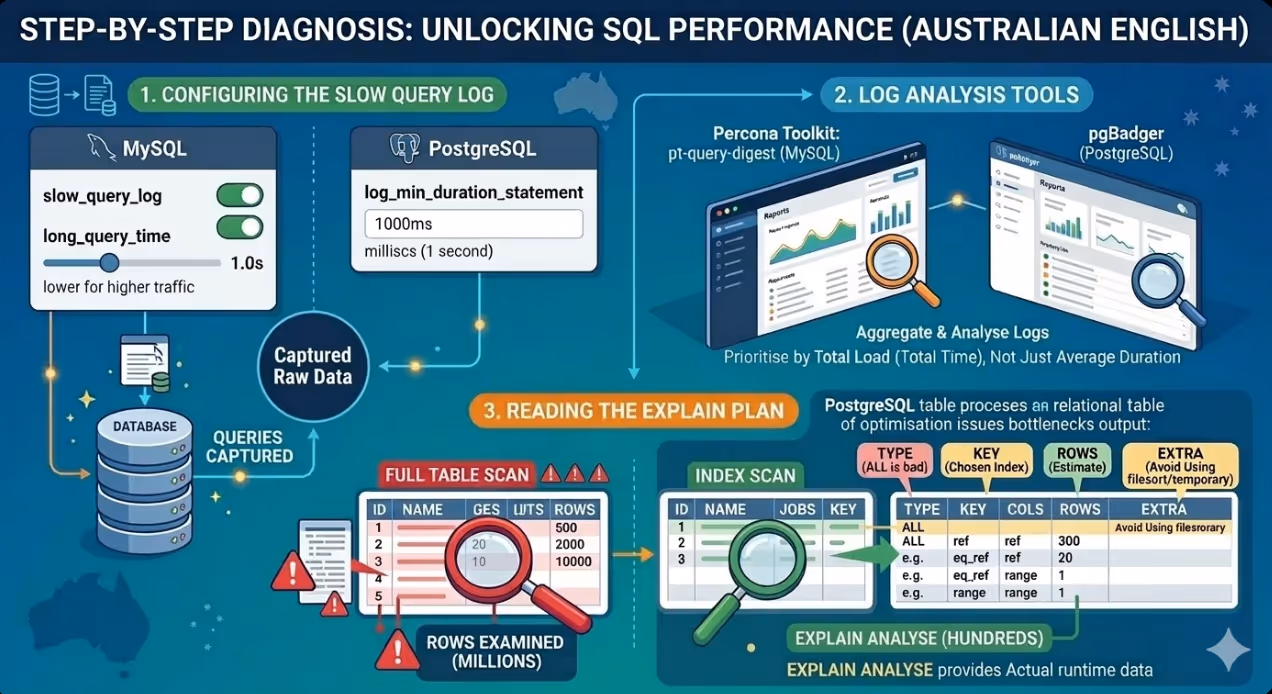
Before any optimisation work begins, the correct approach is to measure rather than guess. The slow query log, available in both MySQL and PostgreSQL, records queries that exceed a defined execution time threshold and provides the raw material for a systematic optimisation investigation.
In MySQL, the slow query log is enabled in the configuration file with the slow_query_log and long_query_time parameters. Setting long_query_time to one second captures queries taking more than one second, which is a reasonable starting threshold for identifying the most impactful problems. For sites with high traffic where even 100-millisecond queries represent significant cumulative load, lowering the threshold to 0.1 seconds will surface a broader range of optimisation candidates.
In PostgreSQL, the equivalent functionality is provided by the log_min_duration_statement parameter, which logs any query exceeding the specified duration in milliseconds.
Once the slow query log is populated with a representative sample of production queries, the queries should be sorted by total execution time (frequency multiplied by average duration) rather than by average duration alone. A query that takes 50 milliseconds but executes 10,000 times per hour contributes more to total database load than one that takes two seconds but executes twice a day.
Tools such as pt-query-digest from the Percona Toolkit for MySQL and pgBadger for PostgreSQL aggregate and analyse slow query log output into readable reports that rank queries by their total impact, making it straightforward to prioritise which queries to address first.
Reading the Execution Plan
The execution plan generated by the EXPLAIN statement reveals the path the query optimiser has chosen to execute the query: which tables are accessed, in what order, using which access method (full table scan versus index scan), how many rows are estimated to be examined at each step, and what join types are being used.
For a MySQL query, the basic EXPLAIN output looks like:
sql
EXPLAIN SELECT p.title, p.published_at, u.name
FROM posts p
JOIN users u ON p.user_id = u.id
WHERE p.status = 'published'
ORDER BY p.published_at DESC
LIMIT 20;
The most important columns in the EXPLAIN output to examine are:
type: The access method for each table. ALL indicates a full table scan, which is the most expensive access method and the clearest signal that an index is needed. index indicates an index scan. ref and eq_ref indicate efficient index lookups. const indicates a lookup via a primary key or unique index, which is optimal.
key: The index being used, if any. A NULL value in this column when the type is ALL confirms that no index is being applied to the table.
rows: The estimated number of rows the optimiser expects to examine. A value of millions for a simple lookup query is a strong signal that indexing is the required intervention.
Extra: Additional information about how the query is being executed. Values such as Using filesort and Using temporary indicate expensive operations that may be avoidable with appropriate index design or query restructuring.
In PostgreSQL, EXPLAIN ANALYZE executes the query and returns both the estimated and actual row counts and execution times, making it more useful than EXPLAIN alone for diagnosing discrepancies between what the optimiser expected and what actually occurred.
Index Design and Implementation
Indexes are the primary performance lever in SQL query optimisation. An index is a data structure that allows the database to locate rows matching a condition without scanning every row in the table. The performance difference between a query running on an unindexed column and the same query running on an indexed column grows proportionally with table size: on a table with one million rows, the difference can be four to five orders of magnitude.
Single Column Indexes
The simplest and most common index covers a single column that appears in a WHERE clause condition. For a query filtering posts by status:
sql
-- Before: full table scan on posts
SELECT * FROM posts WHERE status = 'published';

-- Add an index
CREATE INDEX idx_posts_status ON posts(status);

-- After: index scan, dramatically fewer rows examined
SELECT * FROM posts WHERE status = 'published';
Composite Indexes and Column Order
Composite indexes cover multiple columns and are more powerful than single-column indexes for queries that filter on multiple conditions. The column order within a composite index determines which queries it can serve. MySQL and PostgreSQL use a composite index from left to right: an index on (status, published_at) can serve queries that filter on status alone, or on status and published_at together, but not on published_at alone.
For a query that filters posts by status and sorts by publication date:
sql
CREATE INDEX idx_posts_status_published ON posts(status, published_at DESC);
This composite index allows the database to locate published posts and return them in the correct order without a separate sort operation, eliminating the Using filesort condition that would otherwise appear in the execution plan.
Covering Indexes
A covering index includes all columns that a query needs to return, allowing the database to satisfy the entire query from the index without accessing the underlying table rows at all. For a query that retrieves only a few columns from a large table:
sql
-- A covering index for a common query pattern
CREATE INDEX idx_posts_status_covering
ON posts(status, published_at DESC, title, user_id);
If the query only needs title and user_id from the posts table alongside the status and published_at filter and sort, this index allows the database to return results entirely from the index structure, which is significantly faster than reading the full table rows.
Diagnosing and Fixing N+1 Query Problems
N+1 query problems occur when an application fetches a list of records and then executes an additional query for each record to retrieve related data. The name comes from the pattern: 1 query to get N records, plus N additional queries to get related data for each, producing N+1 total queries.
This is a particularly common problem in applications built with ORM frameworks such as Laravel's Eloquent, Django's ORM, and ActiveRecord in Rails, where the convenience of lazy loading related models can mask the query count implications of the code.
A concrete example: a blog listing page that retrieves the twenty most recent posts and displays the author name for each:
php
// N+1 pattern in Laravel Eloquent — generates 21 queries
$posts = Post::latest()->take(20)->get();
foreach ($posts as $post) {
    echo $post->user->name; // Each access triggers a separate query
}

// Fixed with eager loading — generates 2 queries
$posts = Post::with('user')->latest()->take(20)->get();
foreach ($posts as $post) {
    echo $post->user->name; // No additional queries
}
The ORM-level fix uses eager loading to retrieve all related models in a single additional query rather than one per record. At the raw SQL level, the equivalent fix is replacing the N+1 pattern with a JOIN:
sql
-- Instead of querying users separately for each post:
SELECT p.title, p.published_at, u.name
FROM posts p
JOIN users u ON p.user_id = u.id
WHERE p.status = 'published'
ORDER BY p.published_at DESC
LIMIT 20;
For sites with high traffic, identifying and fixing N+1 problems often produces the largest single performance improvement of any database optimisation, because the query count reduction is proportional to the record count and the cumulative database load reduction is correspondingly significant.
Query Structure Optimisation
Beyond indexing, the structure of a query itself can have significant performance implications. Several common query patterns that degrade performance can be rewritten to produce more efficient execution plans.
Avoiding SELECT *
Retrieving all columns with SELECT * forces the database to read the full row for every matching record, even when only a few columns are needed. Specifying only the required columns reduces the data transferred from storage, reduces memory usage during query execution, and enables covering index optimisation where applicable.
Filtering Before Joining
Applying WHERE conditions before joining tables reduces the number of rows that need to be processed in the join operation. In some query structures, filtering can be moved to a subquery or CTE (Common Table Expression) that reduces the intermediate row set before the join:
sql
-- Less efficient: join first, then filter
SELECT p.title, u.name
FROM posts p
JOIN users u ON p.user_id = u.id
WHERE p.status = 'published' AND p.published_at > '2025-01-01';

-- More efficient when posts table is large: filter first via CTE
WITH recent_posts AS (
    SELECT id, title, user_id
    FROM posts
    WHERE status = 'published' AND published_at > '2025-01-01'
)
SELECT rp.title, u.name
FROM recent_posts rp
JOIN users u ON rp.user_id = u.id;
Using EXISTS Instead of COUNT for Existence Checks
Queries that check whether any matching records exist are more efficiently written with EXISTS than with COUNT(*) > 0. EXISTS stops scanning as soon as the first matching row is found, while COUNT must scan all matching rows to return an accurate count:
sql
-- Less efficient for existence check
SELECT * FROM posts WHERE (SELECT COUNT(*) FROM comments WHERE post_id = posts.id) > 0;

-- More efficient
SELECT * FROM posts WHERE EXISTS (SELECT 1 FROM comments WHERE post_id = posts.id);
Application-Level Query Caching
Even thoroughly optimised queries on indexed tables impose some load on the database, and for sites with high traffic where the same queries are executed thousands of times per hour with identical or nearly identical parameters, caching at the application level can reduce database load significantly by serving results from memory rather than executing the query again on each request.
Redis and Memcached are the most common caching layers for Australian web applications. The implementation pattern involves storing query results as serialised objects with a cache key derived from the query parameters, a time-to-live (TTL) that determines how long the cached result is served before the query is executed again against the database, and cache invalidation logic that clears the cached result when the underlying data changes.
The queries most suitable for application caching are those that:
- Execute frequently with the same or similar parameters
- Return results that change infrequently relative to the query frequency
- Are expensive enough to execute that the caching overhead is justified
Navigation menus, category listings, featured product sets, and homepage content blocks are typical candidates for caching on Australian ecommerce and content sites. Data specific to a user or session is generally not appropriate for shared cache and should be served from the database or a cache layer specific to each user.
FAQs
How should Australian developers prioritise which SQL queries to optimise first on a site with high traffic?
The prioritisation should be based on total database impact rather than on which individual queries are slowest in isolation. Total impact is the product of average execution time multiplied by execution frequency. A query taking 500 milliseconds that executes twice per day has lower total impact than a query taking 20 milliseconds that executes 50,000 times per day. The slow query log aggregated with a tool such as pt-query-digest or pgBadger produces a ranked list sorted by total impact, which provides the correct prioritisation order. Within the queries with the highest impact, those that show a full table scan (type: ALL in MySQL EXPLAIN output) on a large table are typically the quickest wins: adding an appropriate index typically produces dramatic improvements with minimal risk. Queries that are slow for structural reasons (complex joins, subquery inefficiency, or N+1 patterns at the application level) take more investigation to diagnose and fix but often produce the largest absolute improvements.
What is the risk of adding indexes to a production database table on a Australian site with high traffic?
Adding an index to a production table carries two risks that need to be managed carefully. The first is lock contention: in MySQL, the default CREATE INDEX operation acquires a table lock that prevents writes during the index build, which on a large table with high volume of writes can produce a significant outage window. The mitigation is to use CREATE INDEX ... ALGORITHM=INPLACE, LOCK=NONE where the storage engine supports it (InnoDB does for most index types), or to use the pt-online-schema-change tool from the Percona Toolkit, which builds the index on a shadow copy of the table and swaps it in without a full lock. In PostgreSQL, CREATE INDEX CONCURRENTLY builds the index without locking the table for writes, at the cost of a longer build time. The second risk is storage overhead and write performance impact: each additional index increases the storage required for the table and adds a small overhead to INSERT, UPDATE, and DELETE operations as the index must be maintained. For tables with very high write rates, adding indexes should be assessed against the write performance cost as well as the read performance benefit.
When should Australian web developers consider moving to a dedicated read replica or database caching layer rather than continuing to optimise individual queries?
Individual query optimisation should be exhausted first, because the gains available from proper indexing, N+1 resolution, and query restructuring are typically large enough to defer the need for architectural changes by a significant margin. A database running on thoroughly optimised queries with appropriate indexes can serve significantly higher traffic than the same database with unoptimised queries, and the cost of query optimisation is almost always lower than the cost of provisioning and maintaining a read replica infrastructure. The point at which architectural scaling becomes the right investment is when the primary database instance is consistently at high CPU utilisation during peak traffic periods despite having thoroughly optimised queries and appropriate indexes, when the read-to-write ratio is sufficiently high that routing reads to replicas would provide meaningful load relief, and when query result caching cannot adequately cover the query load that is high frequency because results change too frequently to cache effectively. For most Australian websites, query optimisation that is well executed removes the need for architectural scaling for far longer than teams typically expect.
The Database Is Usually Where the Most Recoverable Performance Lives
Performance improvements on the front end are often incremental: shaving 50 milliseconds from asset delivery requires work across multiple optimisation layers and the gains are bounded by the physics of asset size and network latency. Database performance improvements are often transformational: a single query that takes 600 milliseconds without an index and five milliseconds with one produces a 120x improvement in that operation's contribution to page load time from a single change. For Australian website teams investigating persistent performance problems that optimisation of the front end has not resolved, the database layer is almost always the place with the greatest leverage to look next.
Maven Marketing Co works with Australian web development teams on performance audits that include database query analysis, slow query identification, and optimisation implementation across MySQL and PostgreSQL environments.
Talk to the team at Maven Marketing Co →

Table of contents
read more blogs

Is Google Ads Better Than SEO for My Business
One of the biggest questions business owners ask when they are planning online growth is whether they should invest in Google Ads or SEO. Both are strong marketing plays that help your company show up in Google search results, but they do things in separate lanes. Google Ads gives quicker visibility and can bring in leads fast, whereas SEO more or less focuses on slow, steady organic traffic that tends to grow the longer you keep building it. Picking the right direction depends on what you want to achieve, how much money you can spend, how crowded the market is, and how quickly you need results, like sooner rather than later. The good news is you don’t always have to choose one or the other; it’s not exactly a black-and-white situation. If you take time to understand the strongest points of both, you can put together a more sensible digital marketing plan that supports consistent expansion. In this guide, we’ll compare Google Ads vs SEO, explain the main differences, and help you figure out what option makes the most sense for your business.

When Should I Hire a Digital Marketing Agency
Growing a business today takes more than just having a website or throwing a post on social media; customers usually search around online, compare providers, skim reviews, and basically expect the brand to show up with a solid digital presence before they even think about buying. Many businesses try to run their marketing themselves, but there comes a point when “doing it all in-house” becomes clunky and hard to manage, all at once. Knowing when to hire a digital marketing agency can end up making a big, real difference for your growth. If you’re not getting enough leads, or your online visibility feels stuck, or sales are just not moving, the right agency can bring the know-how, plus a clear plan, to help you get noticeably better outcomes. In this guide, we’ll dig into what a digital marketing agency actually does, the usual signs it’s time to bring one on, and how picking the right marketing partner can help your business move forward at a faster pace.

Why Is My Google Ads Budget Running Out So Quickly
Running a successful Google Ads budget isn’t only about throwing more money at it. It’s more like making every dollar, doing a bit extra. A lot of businesses start a Google Ads campaign with big hopes, then find out their daily budget is gone within a few hours, and that feels weird, right? After that, your ads stop showing effectively, new leads slip away, and your return on investment dips. So if your Google Ads budget is running out too fast, don’t stress. It’s a fairly common issue, and in most situations, it can be repaired with the right approach. There are multiple little things that can drain your advertising money quicker than you expected, from costly keywords to audience targeting that just doesn’t quite fit. In this guide, we’ll walk through why your budget disappears so quickly, how to cut wasteful spend, and the most reliable ways to boost your Google Ads ROI, even if your budget stays the same.


