.svg)
.svg)
.svg)


%201.svg)

Key Takeaways
- Calculated fields in Looker Studio allow marketers to create custom metrics and dimensions using formulas applied to existing data source fields, extending reporting beyond what default connectors provide.
- Calculated fields can be created at the data source level, where they are available across all reports using that source, or at the chart level, where they apply only to a single visualisation.
- Looker Studio supports a wide range of formula functions including arithmetic operators, CASE statements, REGEXP functions, text functions, date functions, and aggregation functions, enabling complex business logic to be encoded directly in the report.
- CASE statements are among the most commercially useful calculated field types, enabling segment classification, campaign grouping, channel labelling, and conditional metric logic that reflects the business's own categorisation.
- Blended data sources allow calculated fields to combine metrics from multiple platforms, such as Google Ads and Meta Ads simultaneously, enabling consolidated reporting that no single platform connector can provide alone.
- Calculated fields that produce incorrect results are among the most dangerous reporting errors, because they look authoritative while being wrong. Validation against source platform data is essential after every calculated field is created.
- Regular expressions within REGEXP functions give marketers powerful tools for extracting partial strings from campaign names, URL parameters, and dimension values, enabling flexible segmentation without requiring changes to naming conventions upstream.
Why Default Fields Are Not Enough
Every data connector in Looker Studio delivers the fields that the source platform chooses to expose through its API. Those fields are defined by the platform's own data model: impressions, clicks, spend, sessions, and conversions as the platform defines and counts them. For an Australian marketing team that needs to report against its own business definitions, these defaults create structural limitations that no amount of filter configuration or chart adjustment can overcome.
Consider a business running paid media across Google Ads, Meta Ads, and LinkedIn Ads simultaneously. Each platform reports its own cost and conversion data through its own connector. No standard Looker Studio connector delivers a single blended cost per lead figure that sums spend and conversions across all three platforms in a single calculated value. Without calculated fields and data blending, the report must show three separate cost per lead figures, leaving the reader to mentally aggregate them, or forcing the analyst to maintain a manual consolidation spreadsheet outside the reporting tool.
Consider a business whose marketing team classifies campaigns into strategic tiers: brand defence campaigns, acquisition campaigns, and retention campaigns. The platform does not know these categories. It knows campaign names, and those names may or may not follow a consistent convention. Without calculated fields using CASE statements or regular expressions, the report cannot group campaigns by strategic intent. Every visualisation shows campaigns by their raw platform names, producing a report that is technically accurate but commercially unreadable to anyone who thinks in terms of strategic purpose rather than platform taxonomy.
Calculated fields solve both of these problems, and many more like them, by allowing the marketing team to encode their own business logic directly into the data layer of the Looker Studio report.
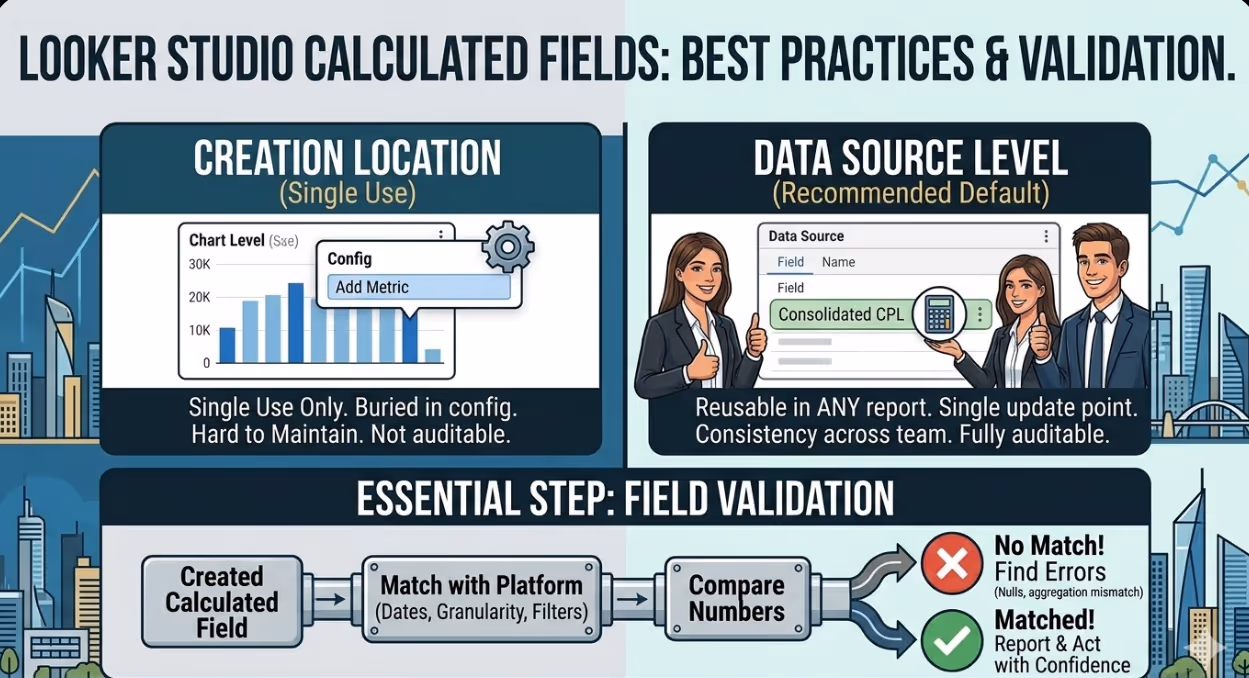
Data Source Level vs Chart Level Calculated Fields
Looker Studio provides two locations where calculated fields can be created, and the choice of location has practical implications for how the field can be used and maintained.
A data source level calculated field is created within the data source editor rather than within a specific report. Once created, it is available as a field in every report that uses that data source, in the same way that natively available fields appear. If the calculation needs to be updated, the change is made in one place and flows through to every report and chart using that field automatically.
A chart level calculated field is created within a specific chart in a specific report, using the Add Metric or Add Dimension options within the chart configuration panel. It is available only in that chart and cannot be reused elsewhere without being recreated. Chart level fields are appropriate for calculations intended for single use or exploratory analysis where the field is not expected to have ongoing use across multiple reports.
For Australian marketing teams managing multiple Looker Studio reports for different stakeholders, creating calculated fields at the data source level is the recommended default. It ensures consistency, reduces the maintenance burden of updating calculations, and makes the logic visible and auditable in a central location rather than buried inside individual chart configurations across multiple reports.
Arithmetic Calculated Fields
The most straightforward calculated fields apply arithmetic to existing numeric fields. Standard use cases include calculating rates, ratios, and derived values that the connector does not provide directly.
Cost per lead, when a standard connector does not provide it, is calculated by dividing total cost by total conversions:
Cost / Conversions
Return on ad spend, expressed as a ratio rather than a percentage, divides revenue by cost:
Conversion Value / Cost
Blended conversion rate combining sessions from GA4 with conversions from an ads connector requires the two sources to be blended first, then the calculation can express the relationship:
Conversions / Sessions
One important arithmetic behaviour to be aware of in Looker Studio is the difference between calculations at the metric level and at the row level. When a calculated field divides one metric by another, Looker Studio by default aggregates each metric across all rows being displayed before dividing. This produces the correct result in most cases: total cost divided by total conversions gives the correct overall cost per conversion for the displayed data. However, if the intention is to calculate a ratio at the row level before aggregating, the calculation must use the CALCULATE function or the field must be structured differently to produce the intended result.
CASE Statements: Encoding Business Classification Logic
CASE statements are the most versatile and commercially powerful calculated field type available in Looker Studio. They allow conditional logic to be applied to any field, assigning a label, value, or category based on whether specified conditions are met.
The basic CASE statement syntax evaluates conditions in sequence and returns the value associated with the first condition that is true:
CASE
  WHEN REGEXP_MATCH(Campaign Name, ".*brand.*") THEN "Brand"
  WHEN REGEXP_MATCH(Campaign Name, ".*acquisition.*") THEN "Acquisition"
  WHEN REGEXP_MATCH(Campaign Name, ".*retention.*") THEN "Retention"
  ELSE "Uncategorised"
END
This field, applied to campaign data, produces a new dimension that classifies every campaign into one of four categories based on patterns in the campaign name, regardless of how the names were actually formatted or how many campaigns exist in the account. The report can then group, filter, and segment by this strategic classification rather than by raw campaign names.
CASE statements can also be applied to metrics rather than dimensions, creating conditional numeric values. A field that assigns a value of one to conversions that meet a quality threshold and zero to those that do not can be used to build a filtered conversion count without requiring the source platform to define the segment:
CASE
  WHEN Conversion Value >= 500 THEN 1
  ELSE 0
END
Summing this field across all rows gives a count of conversions above the value threshold, which can be used alongside total conversions to calculate a quality conversion rate that is meaningful to the business even though the platform has no concept of it.
REGEXP Functions for Flexible Dimension Extraction
Regular expressions in Looker Studio calculated fields allow partial strings to be extracted from text dimensions using pattern matching. This is particularly useful for Australian marketing teams whose campaign naming conventions encode information such as channel, audience, market, or creative format within a structured name string.
A campaign naming convention such as AU_SEM_Brand_Exact_Desktop encodes channel, market, campaign type, match type, and device within a single name. Extracting any one of these components into its own dimension allows the report to segment and filter by that component independently, without requiring any changes to the naming convention in the ad platform.
REGEXP_EXTRACT returns the first match of a pattern within a string:
REGEXP_EXTRACT(Campaign Name, "^([A-Z]{2})_")
This expression extracts the market code consisting of two letters at the beginning of a campaign name following the convention above, producing a Market dimension that can be used to filter the report to a specific market or to show performance comparisons across markets.
REGEXP_MATCH returns a boolean indicating whether a pattern is found within a string, and is commonly used within CASE statements to drive conditional classification as shown in the previous section.
REGEXP_REPLACE substitutes matched text within a string with a replacement value, useful for cleaning or standardising dimension values that contain inconsistent formatting across different accounts or platforms.
For Australian marketing teams managing campaigns across multiple markets and platforms where naming conventions are not perfectly consistent, REGEXP functions provide a layer of normalisation at the reporting level that does not require going back to fix the source data.
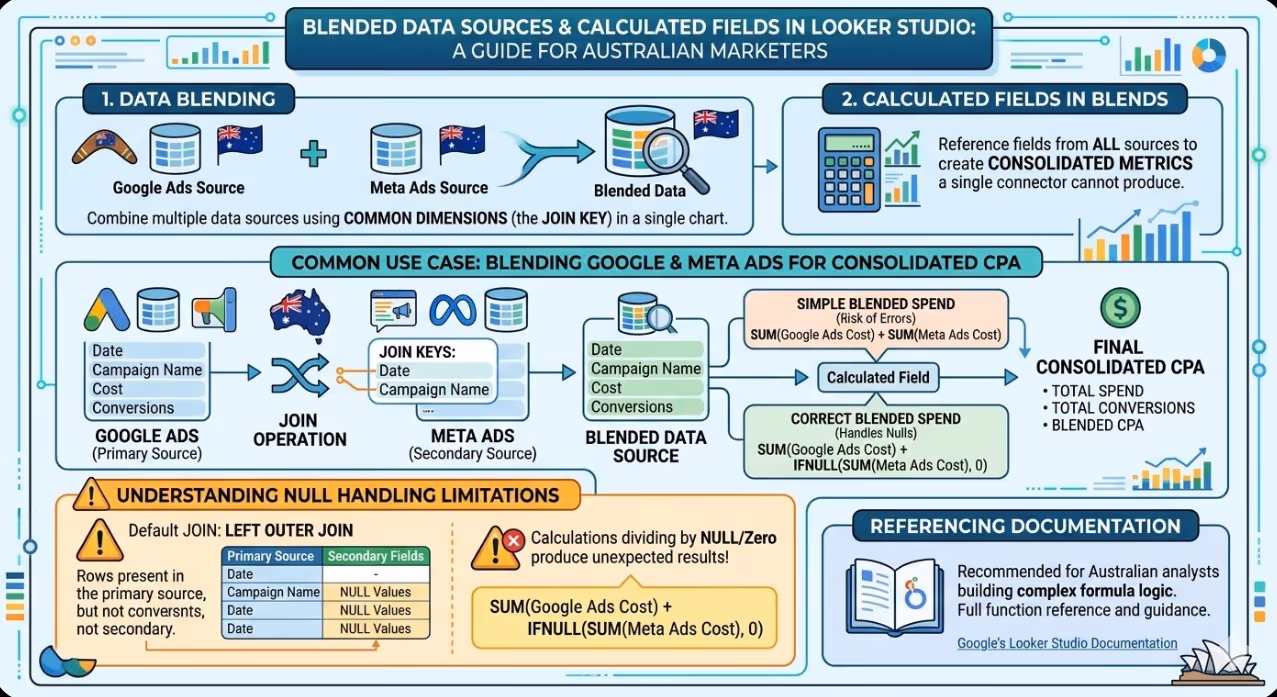
Blended Data Sources and Calculated Fields
Data blending in Looker Studio allows fields from multiple data sources to be combined in a single chart, using a common dimension as the join key. Calculated fields applied to a blended data source can reference fields from all of the constituent sources, enabling consolidated metrics that a single connector cannot produce.
The most common use case for Australian advertisers running multiple platforms is blending Google Ads and Meta Ads data to produce a single total spend, total conversion, and blended cost per acquisition figure. The blend is configured using Date and Campaign Name (or a standardised campaign segment) as join keys, and a calculated field in the blend then sums the cost fields from both sources:
SUM(Google Ads Cost) + SUM(Meta Ads Cost)
This blended cost field can then be divided by a similarly blended conversion count to produce the true consolidated cost per acquisition across platforms that neither platform can report on its own.
Blended data sources have important limitations that affect calculated field reliability. The join is a left outer join by default, meaning rows present in the primary source but not in the secondary source are included with null values for the secondary fields. Calculated fields that divide by a field that may be null will produce errors or unexpected results for those rows. Building null handling into the calculation using IFNULL or COALESCE prevents this:
SUM(Google Ads Cost) + IFNULL(SUM(Meta Ads Cost), 0)
Google's Looker Studio documentation on calculated fields covers the full function reference and provides guidance on the scope and behaviour of different calculated field types, and is the recommended reference for Australian analysts building complex formula logic.
Validating Calculated Fields
Calculated fields that produce incorrect results are among the most consequential reporting errors a marketing team can make. Unlike an obviously broken chart that shows an error message, an incorrectly calculated metric produces a plausible number that gets reported to stakeholders and acted upon without anyone realising it is wrong.
Validation discipline is essential. Every calculated field should be verified against the source platform's native reporting immediately after creation, using a matching date range, the same granularity, and the same filters. If the Looker Studio calculated cost per acquisition for a Google Ads campaign does not match the cost per conversion reported in the Google Ads platform for the same period, the calculation is wrong and must be investigated before the report is used.
Common sources of calculated field error include aggregation level mismatches, where the formula is being applied at a different level of data granularity than intended; null value propagation, where null values in one field cause arithmetic involving that field to return null rather than a valid result; and metric definition differences, where the platform's conversion count includes a different set of conversion actions than what the business intends to measure.
Functionality similar to Query Monitor in Looker Studio is available through the resource section of the report editor, where individual chart data can be exported and inspected to confirm what the underlying query is returning before calculated formulas are applied.
FAQs
Can calculated fields in Looker Studio reference other calculated fields?
Yes, with some constraints. A data source level calculated field can be referenced by another data source level calculated field in the same data source, allowing complex logic to be built up in layers where simpler calculations feed into more complex ones. For example, a blended cost field and a blended conversion field can each be created as separate calculated fields, and a third calculated field can then divide them to produce cost per acquisition. Chart level calculated fields cannot reference other calculated fields and are limited to referencing the native fields of the data source. For Australian analysts building complex metrics built across multiple steps, structuring calculations at the data source level and building them incrementally from simpler constituent fields produces more maintainable and auditable logic than attempting to encode everything in a single formula expression.
Do calculated fields slow down Looker Studio reports?
Complex calculated fields, particularly those involving REGEXP operations on large datasets or those applied within blended data sources with many rows, can increase query processing time and slow report loading. The impact depends on the complexity of the formula, the volume of data being processed, and the number of calculated fields applied to a single chart. For Australian marketing teams experiencing slow report loading, auditing the calculated fields in use and simplifying or removing those that are no longer needed is a worthwhile optimisation step. Looker Studio's data source level caching means that repeated queries with the same parameters and date ranges retrieve cached results rather than querying the underlying connector again, which reduces the performance impact of complex fields for reports that are viewed frequently with consistent parameters.
Are there functions available in Google Sheets that are not available in Looker Studio calculated fields?
Yes. Looker Studio's calculated field function library is not equivalent to Google Sheets and does not include all of the functions available in a spreadsheet environment. Notable absences include array manipulation functions, certain statistical functions, and lookup functions equivalent to VLOOKUP or INDEX MATCH. For calculations that require functionality not available in Looker Studio's formula engine, the recommended approach is to perform the calculation at the data source level, either within Google Sheets if the data source is a sheet, within BigQuery if the data is in Google Cloud, or within the source platform's own reporting tools before the data is connected to Looker Studio. Attempting to replicate complex spreadsheet logic within Looker Studio calculated fields sometimes leads to convoluted formulas that are difficult to maintain and prone to errors that are hard to diagnose.
Reporting That Reflects How the Business Actually Thinks
A Looker Studio report built entirely on default connector fields reports what the platforms measure, in the categories the platforms define. A report built with carefully designed calculated fields reports what the business measures, in the categories the marketing team uses to make decisions. For Australian marketing teams whose reporting is currently constrained by what the platforms provide rather than by what the business needs to know, calculated fields are the capability that closes that gap.
Maven Marketing Co helps Australian businesses build Looker Studio reporting that connects marketing data to commercial outcomes, with the analytical depth to drive real decisions.
Talk to the team at Maven Marketing Co →

Table of contents
read more blogs

Is Google Ads Better Than SEO for My Business
One of the biggest questions business owners ask when they are planning online growth is whether they should invest in Google Ads or SEO. Both are strong marketing plays that help your company show up in Google search results, but they do things in separate lanes. Google Ads gives quicker visibility and can bring in leads fast, whereas SEO more or less focuses on slow, steady organic traffic that tends to grow the longer you keep building it. Picking the right direction depends on what you want to achieve, how much money you can spend, how crowded the market is, and how quickly you need results, like sooner rather than later. The good news is you don’t always have to choose one or the other; it’s not exactly a black-and-white situation. If you take time to understand the strongest points of both, you can put together a more sensible digital marketing plan that supports consistent expansion. In this guide, we’ll compare Google Ads vs SEO, explain the main differences, and help you figure out what option makes the most sense for your business.

Why Is My Google Ads Budget Running Out So Quickly
Running a successful Google Ads budget isn’t only about throwing more money at it. It’s more like making every dollar, doing a bit extra. A lot of businesses start a Google Ads campaign with big hopes, then find out their daily budget is gone within a few hours, and that feels weird, right? After that, your ads stop showing effectively, new leads slip away, and your return on investment dips. So if your Google Ads budget is running out too fast, don’t stress. It’s a fairly common issue, and in most situations, it can be repaired with the right approach. There are multiple little things that can drain your advertising money quicker than you expected, from costly keywords to audience targeting that just doesn’t quite fit. In this guide, we’ll walk through why your budget disappears so quickly, how to cut wasteful spend, and the most reliable ways to boost your Google Ads ROI, even if your budget stays the same.

The Link Building Playbook That Still Works in 2026: Earn Authority Without Paying for It
Link building has a reputation problem it does not entirely deserve. When most Australian marketing teams hear the term, they picture one of two things: the paid link schemes that Google has been penalising for years and that still circulate in the shadier corners of the SEO industry, or the outreach programmes that require significant labour that produce a handful of marginal links per month at a cost that makes the return on investment look questionable at best. Both of these pictures miss the methods that actually work in 2026, which share a common characteristic: they earn links as a byproduct of producing something valuable rather than acquiring them as a standalone purchase or extraction exercise. The distinction matters commercially because earned links are structurally different from purchased links. They tend to come from more relevant and more authoritative sources. They are more stable because they are not contingent on a payment being maintained. They are more likely to produce lasting ranking improvements because they represent genuine signals of editorial endorsement. And they are not a liability that sits waiting for the next Google spam update to detonate. This article covers the link earning methods that Australian businesses and their marketing teams can execute in 2026 to build domain authority through genuine editorial signals rather than purchases or schemes.


