.svg)
.svg)
.svg)


%201.svg)
Quick Answers
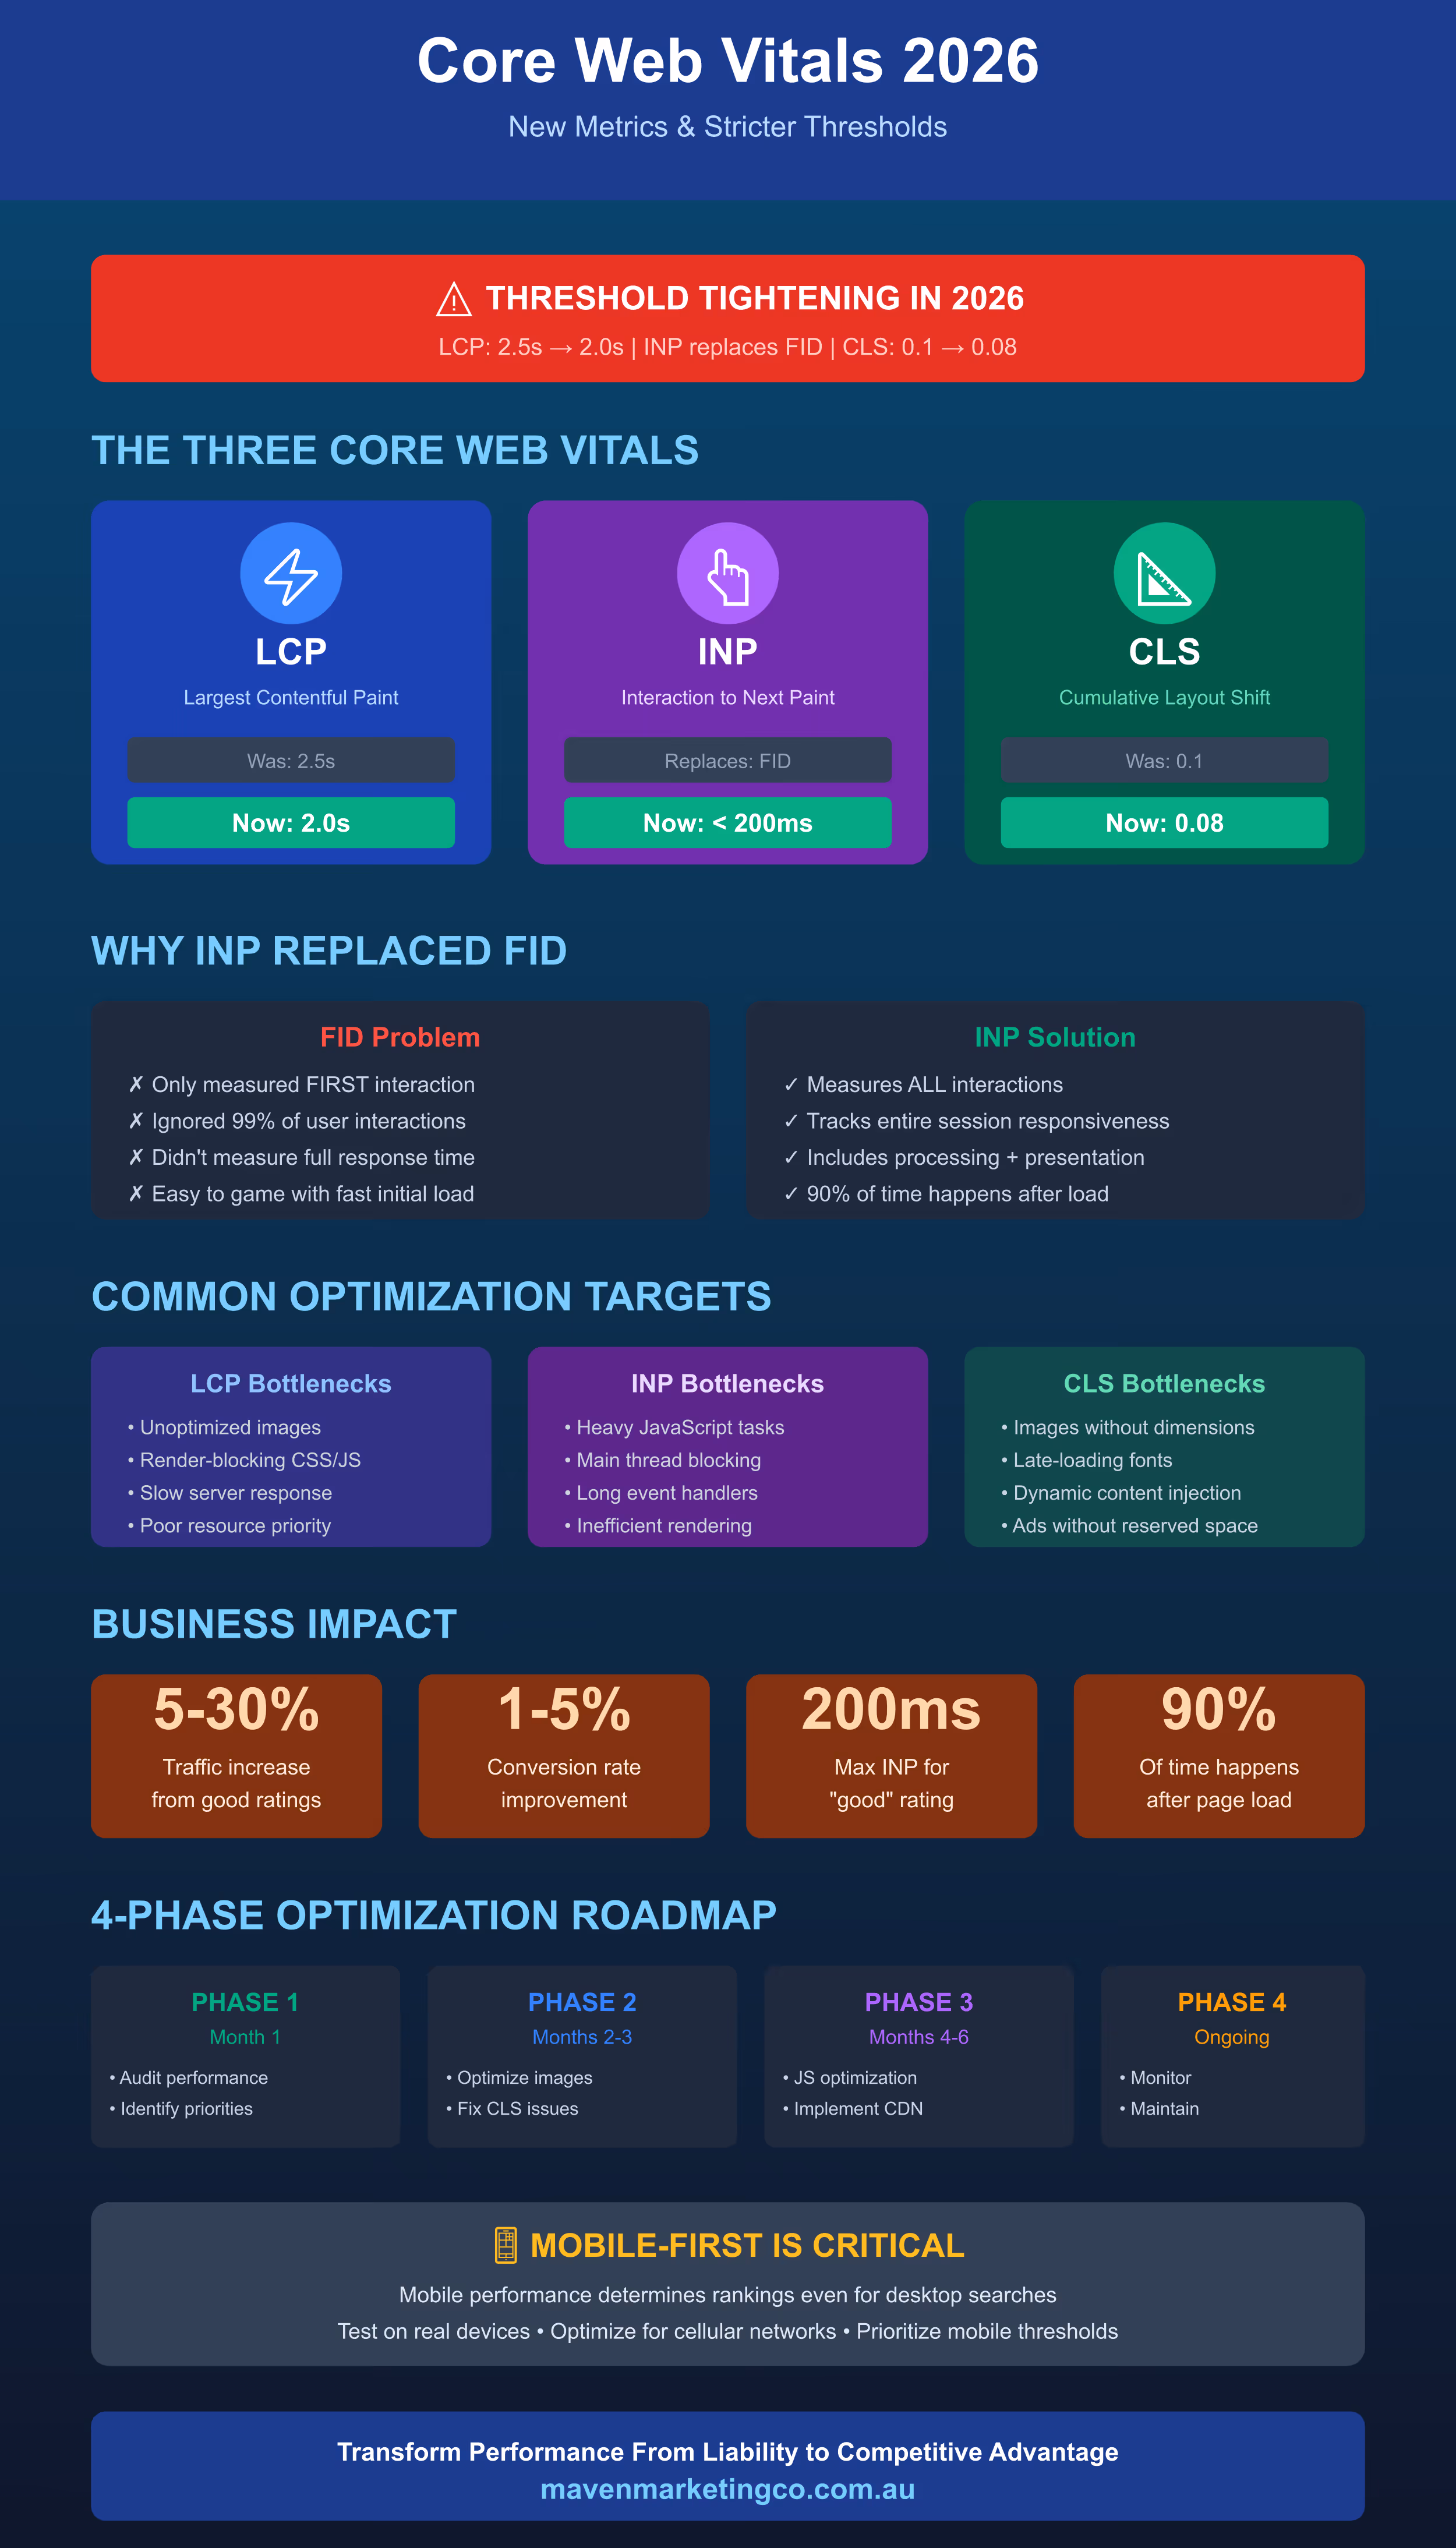
What is Interaction to Next Paint (INP) and why did it replace First Input Delay in 2026?
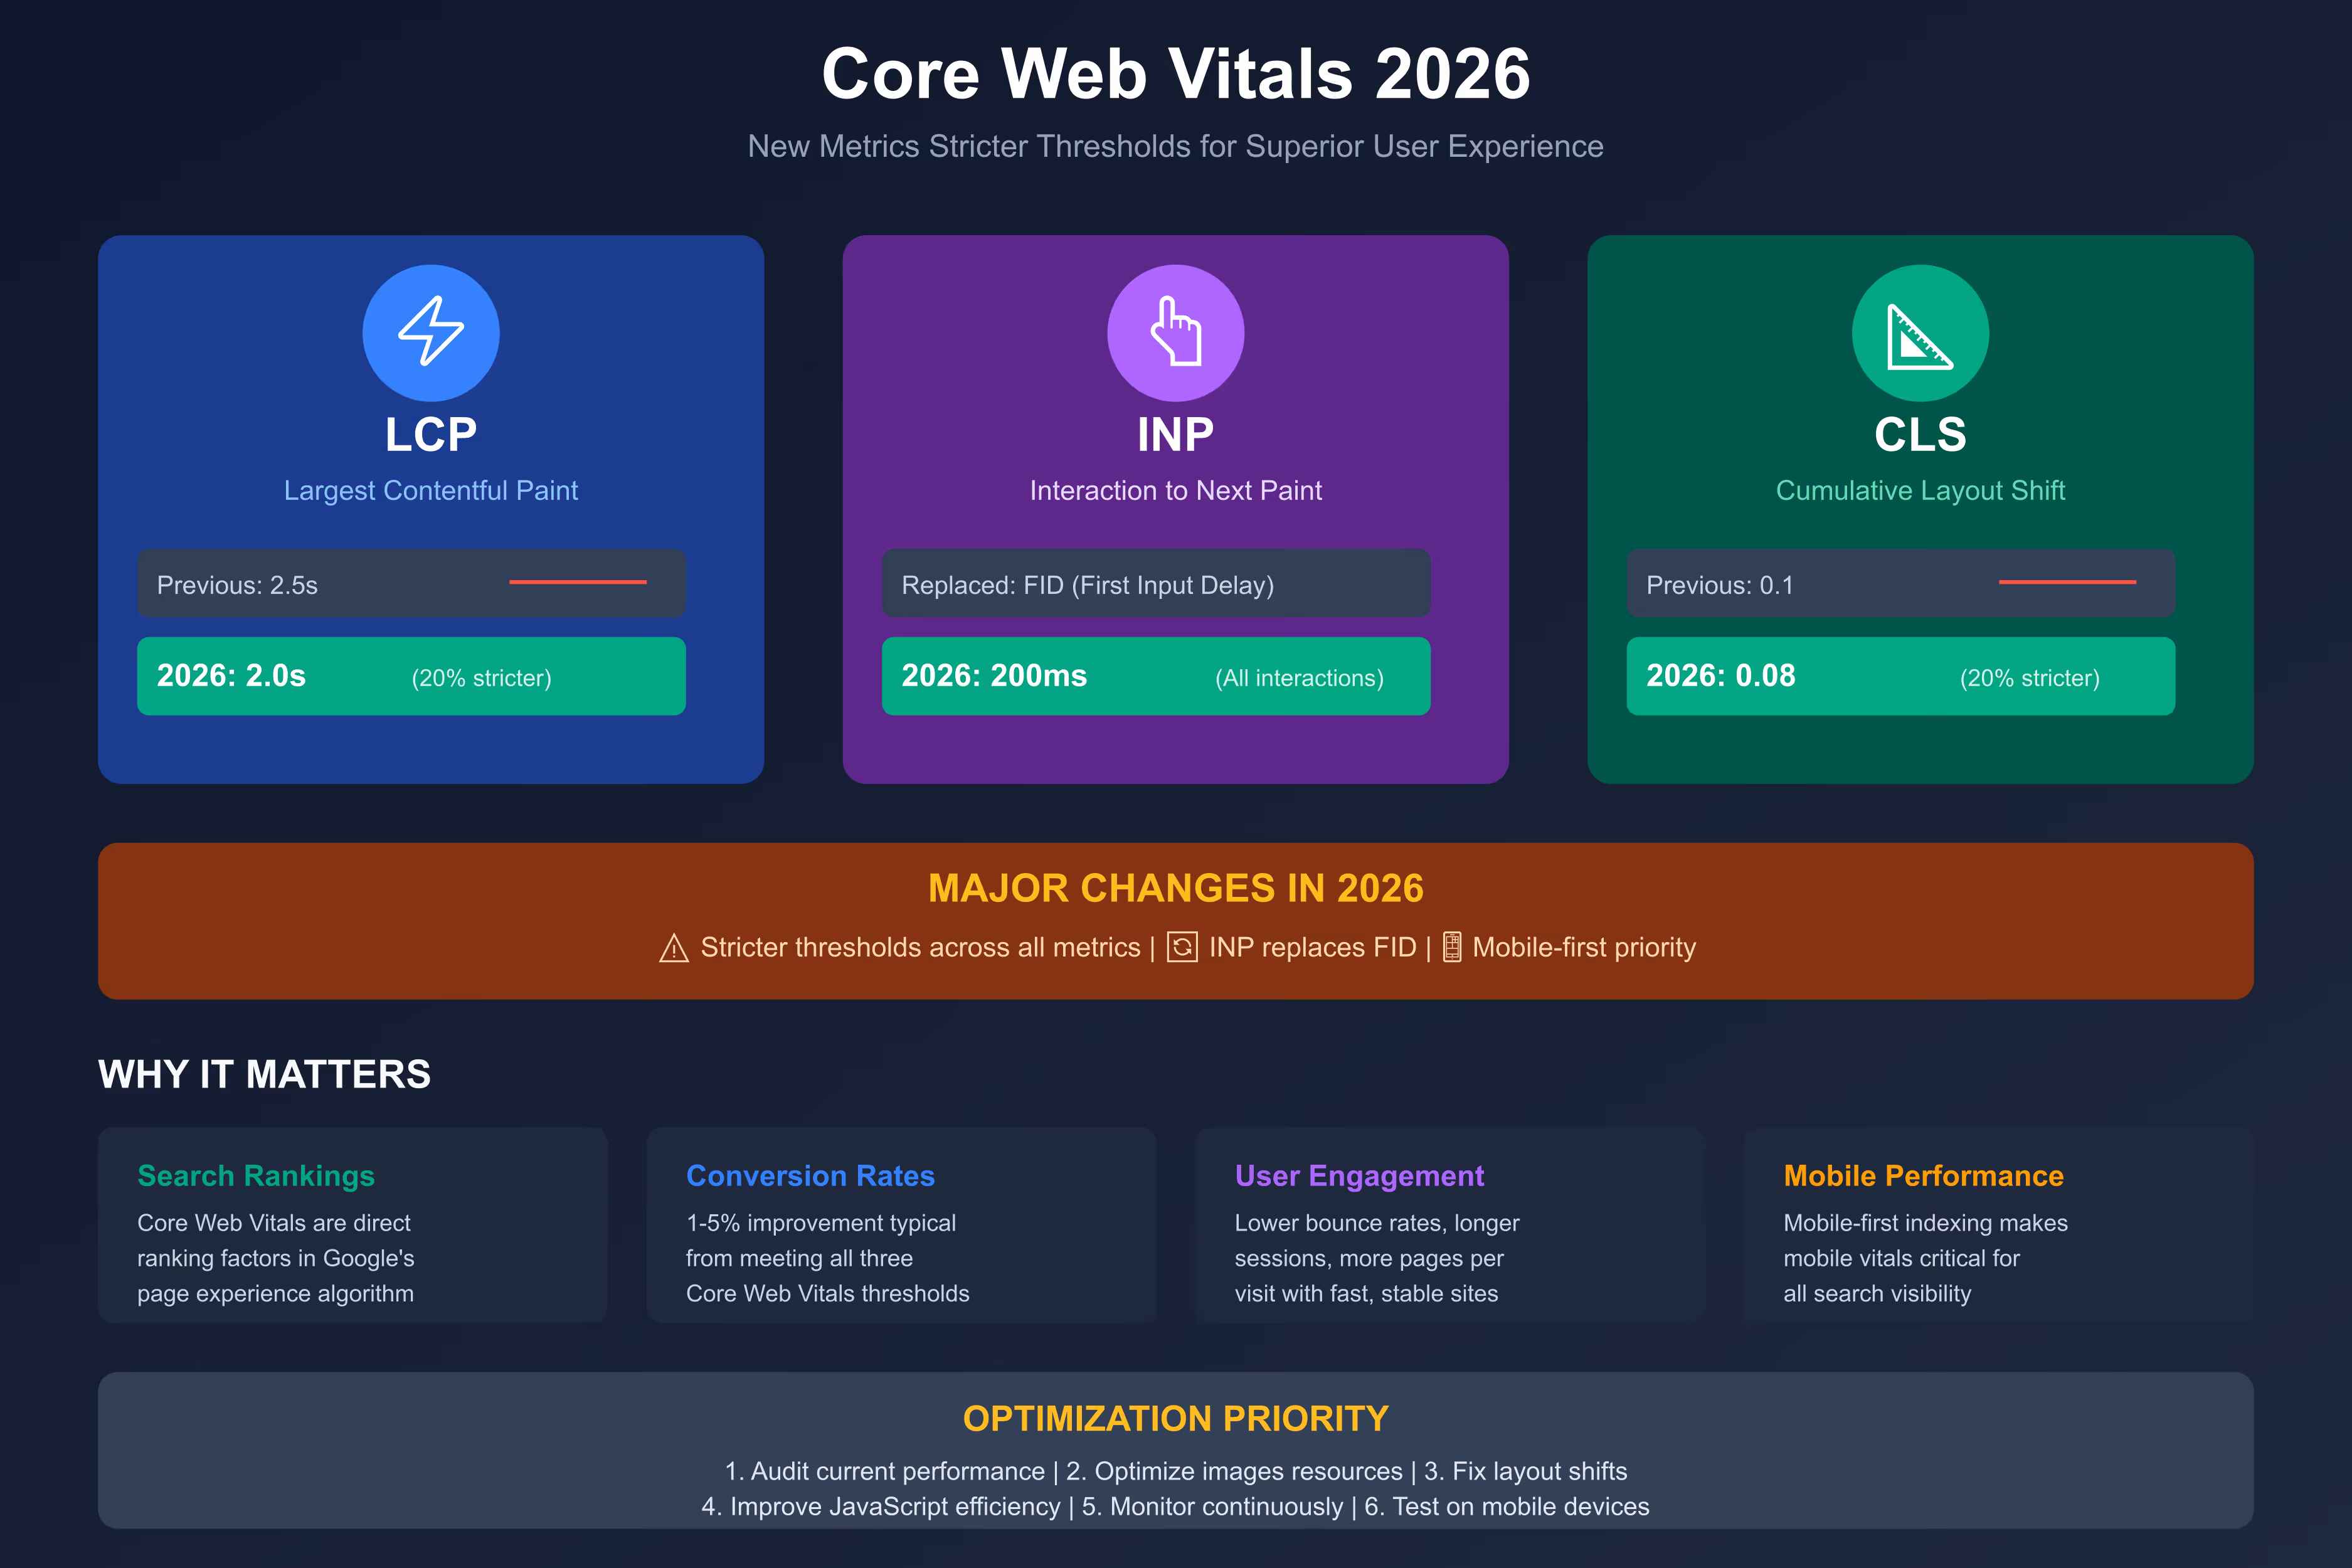
Interaction to Next Paint measures the latency of all user interactions throughout the page lifecycle, providing a comprehensive view of interactive performance that First Input Delay could not deliver. INP captures the complete duration of every click, tap, and keyboard interaction, measuring input delay, processing time, and presentation delay before the next visual frame appears. This differs fundamentally from FID which only measured the first interaction and ignored subsequent responsiveness. Google made this change because Chrome usage data shows 90% of user time on pages happens after initial load, making sustained responsiveness more critical than first-interaction speed alone. INP officially became a Core Web Vital in March 2024, with full implementation continuing through 2026 as businesses adapt to measurement and optimization requirements. Good INP scores require responses under 200 milliseconds across all interactions, not just the first one. For Australian businesses, this shift demands rethinking performance optimization from load-focused strategies to maintaining responsive experiences throughout entire sessions, particularly on mobile devices where interaction complexity and network constraints create greater challenges.
What are the new Core Web Vitals thresholds for 2026 and how do they affect Australian businesses?
The 2026 Core Web Vitals thresholds represent significant tightening across all three core metrics: Largest Contentful Paint must occur under 2.0 seconds (down from 2.5s), Interaction to Next Paint must remain under 200 milliseconds for all interactions, and Cumulative Layout Shift must stay below 0.08 (down from 0.1). These stricter requirements reflect rising user expectations and improving baseline web performance globally. Australian businesses face particular challenges because mobile performance consistently trails desktop by approximately 40%, yet mobile traffic dominates for most industries. Sites currently scoring "Good" under previous thresholds may find themselves reclassified as "Needs Improvement" under 2026 standards without optimization. The implications extend beyond search rankings to user experience metrics including bounce rate, conversion rate, and session duration, all of which correlate strongly with Core Web Vitals performance. Google will incorporate these metrics into ranking algorithms with increasing weight, meaning sites failing to meet thresholds face progressive visibility decline. Australian businesses must audit current performance, identify gap areas, implement optimization strategies, and establish continuous monitoring processes ensuring sustained compliance as Google raises the bar on acceptable user experience.
Your website passed Core Web Vitals assessment last quarter. This quarter, Google reclassified dozens of your pages from "Good" to "Needs Improvement" without any changes on your end.
The goalposts moved. Are you still in the game?
Understanding the 2026 Core Web Vitals Landscape
Core Web Vitals have evolved from technical curiosities discussed mainly by developers into business-critical metrics determining search visibility, user retention, and revenue outcomes. The 2026 updates represent Google's most significant recalibration since introducing these metrics, reflecting both rising user expectations and improving baseline performance across the web.
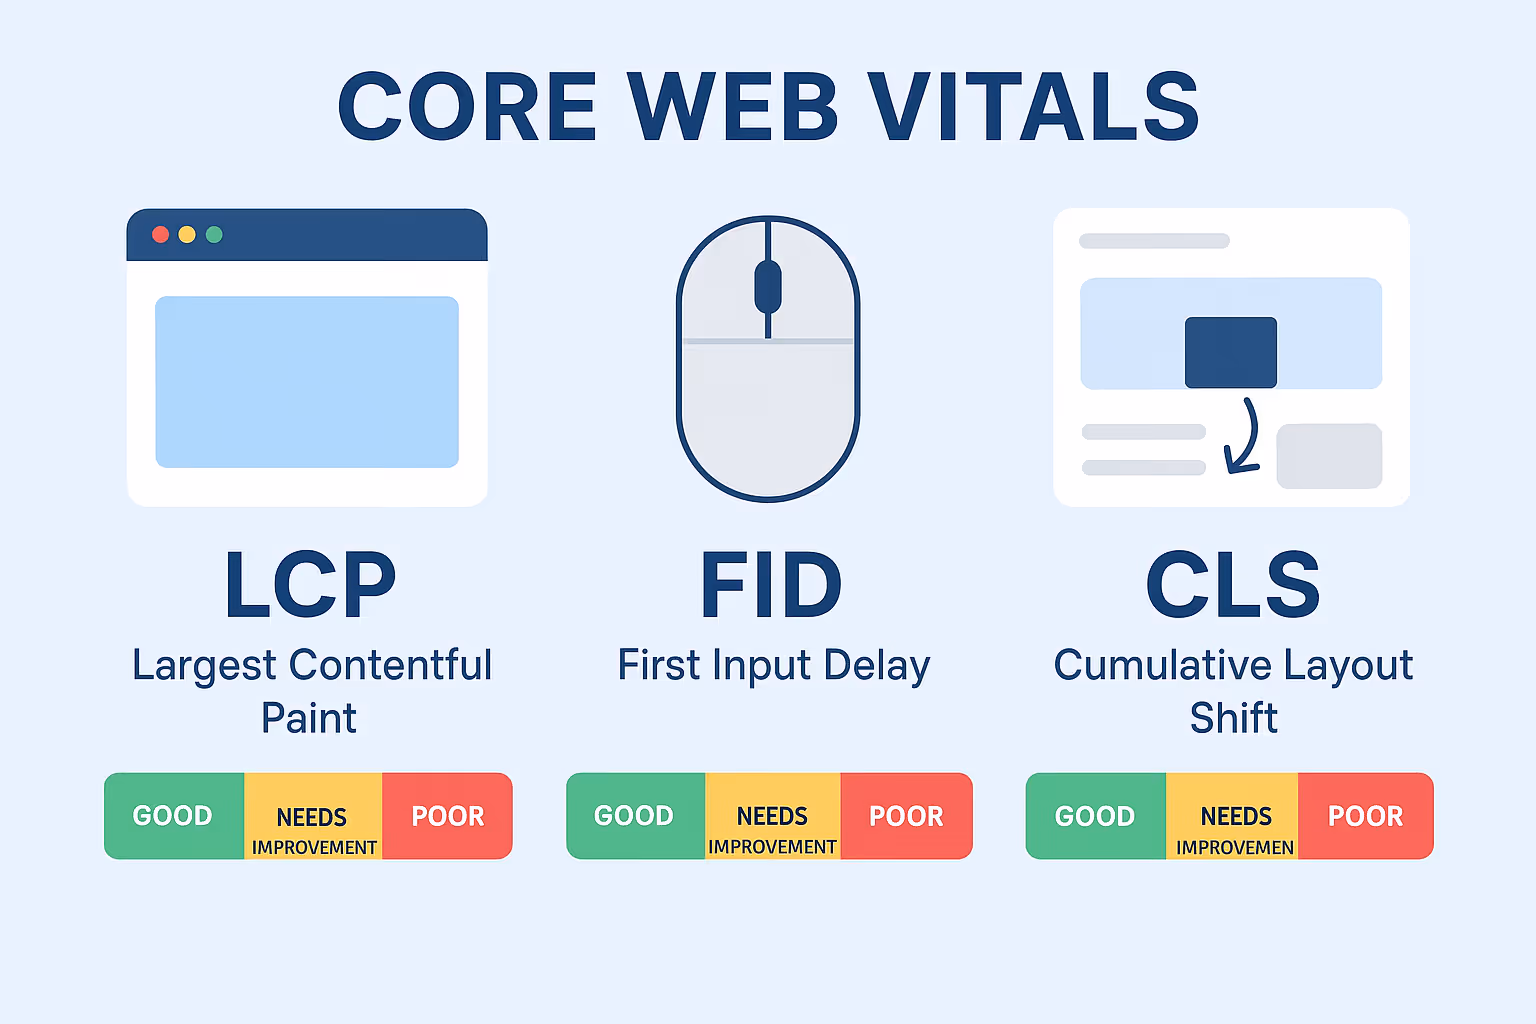
The three Core Web Vitals measure fundamentally different aspects of user experience. Largest Contentful Paint captures loading performance by measuring when the largest visible content element renders. Interaction to Next Paint assesses responsiveness by tracking how quickly pages react to all user interactions. Cumulative Layout Shift evaluates visual stability by quantifying unexpected layout movements frustrating users.
Together, these metrics create a comprehensive view of page experience quality. A site might load quickly but respond sluggishly to clicks. Another might be responsive but suffer from content jumping around during page load. Core Web Vitals require excellence across all three dimensions simultaneously.
For Australian businesses, Core Web Vitals matter because Google explicitly incorporates them into ranking algorithms as part of page experience signals. Sites delivering superior user experiences through fast loading, immediate responsiveness, and visual stability gain ranking advantages over slower competitors with identical content quality and authority.
Beyond rankings, Core Web Vitals correlate strongly with business metrics. Research consistently shows that improving LCP, INP, and CLS drives measurable improvements in bounce rate, session duration, pages per visit, and conversion rates. Users experiencing smooth, responsive pages simply engage more and convert more frequently.
The INP Revolution: Why Google Replaced FID
The transition from First Input Delay to Interaction to Next Paint represents Google's recognition that initial responsiveness alone inadequately captures user experience quality in modern web applications.
FID's Fatal Limitation
First Input Delay measured only the first interaction users made with pages, typically within seconds of arrival. This created a significant blind spot. A site could score excellently on FID by being responsive immediately after load, then become sluggish as users navigated, clicked additional elements, or interacted with dynamic features.
Modern web applications demand sustained responsiveness. Users perform dozens or hundreds of interactions during typical sessions: clicking navigation menus, expanding accordions, submitting forms, adding cart items, applying filters, and countless other actions. FID told you nothing about 99% of these interactions.
Additionally, FID only measured input delay, the time between user action and browser beginning to process the event. It ignored processing time and presentation delay before the next visual frame appeared. A site could have minimal input delay but still feel unresponsive if JavaScript execution or rendering took excessive time.
How INP Provides Complete Visibility
INP addresses these limitations by measuring the latency of all interactions throughout the entire page lifecycle. It captures every click, tap, and keyboard interaction, recording the complete duration from user input to the next painted frame appearing on screen.
INP reports a single value representing the slowest interaction experienced during the visit (technically the 98th percentile to exclude statistical outliers). This worst-case measurement ensures sites cannot game the metric by optimizing only the first interaction whilst allowing subsequent interactions to suffer.
The three components INP measures together create comprehensive responsiveness assessment. Input delay measures time from user action to event handler beginning execution. Processing time captures how long JavaScript takes to complete execution. Presentation delay tracks time until the browser renders and displays the next frame.
For Australian businesses, INP demands sustained performance optimization, not just fast initial loads. E-commerce sites must ensure add-to-cart buttons respond instantly even after users browse dozens of products. SaaS applications must maintain responsiveness as users interact with complex features. Content sites must keep navigation and filtering controls snappy throughout long sessions.
The 200 Millisecond Threshold
Google defines good INP as under 200 milliseconds, needs improvement as 200 to 500 milliseconds, and poor as above 500 milliseconds. The 200ms threshold stems from human perception research showing interactions feeling instant below this duration.
Achieving good INP requires deliberate JavaScript optimization, efficient event handling, and careful attention to main thread blocking. Many Australian websites that scored well on FID struggle with INP because their code performs adequately during initial load but degrades as application state grows complex or background tasks consume processing power.
Stricter LCP Thresholds: The 2.0 Second Challenge
Largest Contentful Paint thresholds tightened significantly for 2026, with good performance now requiring LCP under 2.0 seconds compared to the previous 2.5 second standard. This half-second reduction creates substantial challenges for Australian businesses, particularly those serving mobile users over cellular networks.
Why Google Raised the Bar
The tightening reflects improving baseline performance across the web as technologies like HTTP/3, image format improvements (WebP, AVIF), and content delivery network optimization become standard. Google recognized that 2.5 seconds, appropriate when established, now represented dated expectations as users experienced faster sites elsewhere.
Mobile performance drove the threshold change particularly. Desktop sites generally achieve good LCP easily given fast broadband connections and powerful processors. Mobile remains the challenge, with cellular network latency, limited bandwidth, and constrained device capabilities creating performance barriers.
Yet mobile traffic dominates most industries. Australian businesses cannot ignore mobile LCP, as the majority of their users experience sites through smartphones. Google's mobile-first indexing means mobile performance directly determines rankings even for desktop searches.
Common LCP Bottlenecks
Most LCP failures stem from predictable causes that systematic optimization addresses. Unoptimized images represent the single largest culprit, with sites serving unnecessarily large files that consume bandwidth and processing time. Images should be compressed properly, sized correctly for display dimensions, and delivered in modern formats like WebP or AVIF.
Render-blocking resources delay LCP by forcing browsers to wait before displaying content. CSS and JavaScript files loaded in the document head block rendering until completely downloaded and parsed. Critical CSS should be inlined, whilst non-critical resources load asynchronously or defer until after initial render.
Slow server response times directly extend LCP by delaying when browsers receive HTML. Australian businesses using overseas hosting face particular challenges as distance increases latency. Local hosting or content delivery networks with Australian edge locations significantly improve time to first byte, accelerating LCP.
Inefficient resource loading prioritization causes browsers to request resources in suboptimal order. The largest contentful paint element should receive priority, with preload hints or resource hints guiding browsers to fetch critical resources earliest.
Optimization Strategies
Achieving 2.0 second LCP demands systematic approaches addressing multiple factors simultaneously. Image optimization should be automated through build processes or services that compress images, convert to modern formats, and generate responsive variants. Australian businesses can use services like Cloudflare Images or Imgix automating these transformations.
Critical rendering path optimization ensures above-the-fold content loads and renders immediately whilst deferring below-the-fold resources. Inline critical CSS directly in HTML whilst loading full stylesheets asynchronously. Defer JavaScript execution until after initial paint using defer or async attributes appropriately.
Content delivery networks with Australian presence reduce latency for Australian audiences significantly. CDNs cache static assets at edge locations geographically close to users, eliminating distance-based delays. Services like Cloudflare, Fastly, or AWS CloudFront offer Australian points of presence.
Server-side rendering or static site generation eliminates client-side rendering delays by delivering complete HTML immediately. Modern frameworks like Next.js, Nuxt, or Gatsby enable these approaches whilst maintaining developer-friendly component-based architecture.
CLS Improvements: Achieving 0.08 Visual Stability
Cumulative Layout Shift requirements tightened from 0.1 to 0.08 for good ratings, reflecting Google's increasing emphasis on visual stability as fundamental to user experience quality.
Understanding CLS Mechanics
CLS quantifies unexpected layout shifts users experience during page load and throughout their visit. Each layout shift receives a score based on the viewport fraction affected and the distance elements moved. CLS sums these individual shift scores across the page lifecycle.
A score of 0.08 means elements shifted by an amount totaling 8% of the viewport. Lower scores indicate more stable experiences where content remains where users expect, preventing frustrating misclicks or lost reading positions.
Common CLS Culprits
Images and videos without explicit dimensions cause CLS when browsers must reflow content after determining media file sizes. Always specify width and height attributes on media elements, allowing browsers to reserve appropriate space during initial layout.
Web fonts loading late can trigger CLS when browser-default fonts are replaced by custom fonts with different metrics. Use font-display: swap with caution, or preload critical fonts ensuring they load before text renders.
Dynamically injected content including advertisements, embedded widgets, and cookie banners frequently causes CLS by pushing existing content downward after insertion. Reserve space for dynamic content using min-height CSS properties or placeholder elements.
Animations and transitions modifying element geometry trigger CLS unless using transform or opacity properties that do not affect layout. Avoid animating top, left, width, or height values.

Achieving 0.08 Stability
Systematic CLS optimization starts with identifying specific shifts causing score problems. Chrome DevTools' Performance panel and Layout Instability API reveal which elements shift and when during page load.
Set explicit dimensions on all images and videos, using aspect-ratio CSS when responsive sizing is required. Modern browsers support aspect-ratio natively, maintaining dimensions whilst allowing flexible scaling.
Preload critical web fonts ensuring they load before first paint. Use font-display: optional for non-critical fonts, allowing browsers to render with system fonts if web fonts are not available immediately.
Reserve space for dynamic content including ads and embeds using min-height or aspect-ratio. Cookie consent banners should slide in from edges rather than pushing content, or appear before initial content render.
Test CLS across different network conditions and device capabilities. Slow connections exacerbate CLS as resources load more gradually, potentially revealing shifts not visible on fast connections.
Mobile Performance: The Australian Challenge
Australian businesses face particular mobile performance challenges stemming from geographic factors, network infrastructure, and device diversity.
Distance and Latency
Australia's geographic distance from major content origins creates inherent latency disadvantages. Sites hosted in US or European data centers face round-trip times exceeding 200 milliseconds from Australian locations, consuming significant portions of performance budgets before content even begins transferring.
Content delivery networks partially address this through Australian edge locations caching static assets locally. However, dynamic content still requires origin server communication, limiting how much CDNs help for personalized experiences.
Network Infrastructure Reality
While Australian urban centers enjoy solid 4G and 5G coverage, regional areas and even some suburban locations experience inconsistent connectivity. Users moving between coverage zones or in areas with congested networks face degraded performance that stress-tests site resilience.
Additionally, many Australians still use limited mobile data plans, making them conscious of data consumption. Sites delivering bloated payloads create poor experiences for users monitoring data usage carefully.
Device Diversity
Australian mobile users span vast device capability ranges from premium flagship phones to budget Android devices several years old. Performance optimization must accommodate lower-end devices with limited processing power and memory.
Sites performing well on developer machines with high-end hardware may become unusable on constrained devices where JavaScript execution takes substantially longer and memory limitations cause browser throttling.
Optimization for Australian Mobile Reality
Implement aggressive resource budgets limiting JavaScript, CSS, and image payloads. Every kilobyte counts on cellular networks, particularly for users on 3G fallback or congested networks.
Use responsive images serving appropriately sized variants to different devices. Deliver small images to mobile devices rather than forcing them to download and resize desktop-sized assets.
Implement service workers enabling offline functionality and caching strategies improving performance for repeat visits. Australian users with inconsistent connectivity particularly benefit from offline capabilities.
Test on real Australian network conditions using Chrome DevTools' network throttling or services providing actual device testing. Synthetic testing on developer hardware over office networks rarely reveals real-world mobile experience quality.

Measuring Core Web Vitals: Tools and Techniques
Accurate measurement forms the foundation of Core Web Vitals optimization. Multiple tools provide complementary perspectives on performance.
Field Data vs Lab Data
Field data comes from real users visiting your site, captured through Chrome User Experience Report (CrUX) or Real User Monitoring (RUM) solutions. Field data reveals actual user experiences across diverse devices, networks, and usage patterns.
Lab data comes from controlled testing environments using tools like Lighthouse or PageSpeed Insights. Lab data provides consistency and repeatability whilst enabling testing before deployment.
Both data types serve essential but different purposes. Field data shows whether actual users experience good performance. Lab data helps diagnose specific issues and test optimization effectiveness before production deployment.
Essential Measurement Tools
Google Search Console's Core Web Vitals report shows field data for your site grouped by URL patterns, revealing which pages meet or fail thresholds. This report uses CrUX data, updated regularly with actual Chrome user measurements.
PageSpeed Insights combines field and lab data in a single interface, showing both CrUX field measurements and Lighthouse lab test results. This dual view helps correlate real-world performance with testable factors.
Chrome DevTools provides detailed diagnostic capabilities including Performance panel for recording page loads, Lighthouse panel for comprehensive audits, and specialized Web Vitals extensions measuring LCP, INP, and CLS in real-time during testing.
Real User Monitoring solutions like SpeedCurve, Calibre, or Sentry track actual user experiences continuously, providing detailed breakdowns by geography, device type, and browser version. RUM reveals performance variations that averaged CrUX data might mask.
Establishing Baseline and Tracking Progress
Begin by establishing current performance baselines across all three Core Web Vitals for both mobile and desktop. Document what percentage of page loads meet good thresholds for LCP, INP, and CLS.
Set realistic improvement targets based on current performance and technical constraints. Moving from poor to needs improvement represents meaningful progress even if good ratings remain future goals.
Track metrics weekly or monthly, comparing against baselines and previous periods. Look for regressions when introducing new features or content, ensuring performance remains priority throughout development cycles.
Implement automated testing catching performance regressions before production deployment. CI/CD pipelines should include Lighthouse testing failing builds that regress performance beyond acceptable thresholds.
Implementation Roadmap for Australian Businesses
Systematic Core Web Vitals optimization follows phased approaches preventing teams from becoming overwhelmed whilst delivering continuous improvement.
Phase 1: Assessment and Prioritization (Month 1)
Audit current Core Web Vitals performance using Google Search Console, PageSpeed Insights, and any existing RUM solution. Document what percentage of page loads currently meet good thresholds for LCP, INP, and CLS on both mobile and desktop.
Identify highest-impact pages based on traffic volume and business value. Home pages, product landing pages, and high-traffic blog posts deserve priority optimization given their visitor concentration.
Categorize issues by fix difficulty and impact. Quick wins providing substantial improvement with minimal effort should be addressed immediately whilst complex architectural changes can be planned for later phases.
Phase 2: Critical Fixes (Months 2-3)
Address image optimization comprehensively using automated tools compressing images, converting to modern formats, and generating responsive variants. Services like Cloudinary or Imgix integrate easily with most platforms.
Implement render-blocking resource optimization by inlining critical CSS, deferring non-critical JavaScript, and using async or defer attributes appropriately. Audit which resources truly require blocking versus which can load asynchronously.
Fix CLS issues by adding explicit dimensions to images and videos, preloading critical fonts, and reserving space for dynamic content. Use Chrome DevTools identifying specific elements causing layout shifts.
Phase 3: Advanced Optimization (Months 4-6)
Optimize JavaScript execution reducing main thread blocking time. Implement code splitting delivering only necessary JavaScript for each page. Use dynamic imports loading features on-demand rather than upfront.
Implement content delivery network with Australian edge locations caching static assets near users. Configure proper cache headers ensuring CDN serves assets efficiently without unnecessary origin requests.
Consider server-side rendering or static site generation eliminating client-side rendering delays. Modern frameworks make these approaches accessible whilst maintaining development velocity.
Phase 4: Monitoring and Continuous Improvement (Ongoing)
Establish continuous monitoring through RUM solution or regular PageSpeed Insights testing. Set alerts notifying teams when performance degrades beyond acceptable thresholds.
Implement performance budgets preventing feature additions that degrade performance beyond agreed limits. Include Lighthouse testing in CI/CD pipelines catching regressions before production.
Regularly review performance metrics identifying new optimization opportunities as technology evolves and Google raises standards further.
The Business Case: ROI of Core Web Vitals Investment
Core Web Vitals optimization requires investment in tools, developer time, and ongoing maintenance. The business case justifies this investment through measurable improvements in key metrics.
Search Visibility and Traffic
Sites meeting Core Web Vitals thresholds gain ranking advantages in Google's algorithm. Whilst page experience represents one of many ranking factors, marginal visibility improvements compound significantly for competitive keywords.
Australian businesses report traffic increases ranging from 5% to 30% after achieving good Core Web Vitals ratings, with larger gains in competitive industries where many sites fail performance thresholds.
Conversion Rate Improvements
Multiple studies demonstrate correlation between Core Web Vitals and conversion rates. Users experiencing smooth, responsive pages simply convert more frequently than those frustrated by slow, janky experiences.
E-commerce sites typically see 1% to 5% conversion rate improvements from Core Web Vitals optimization, translating to substantial revenue increases given most sites' traffic volumes.
User Engagement Metrics
Bounce rate decreases as LCP improves, with users more likely to remain on sites that load quickly. Session duration and pages per visit increase as INP improves, since responsive interactions encourage continued exploration.
These engagement improvements create compounding benefits as users who stay longer and visit more pages have greater opportunities to convert whilst also generating more engagement signals potentially improving SEO further.
Competitive Differentiation
In industries where most competitors fail Core Web Vitals thresholds, achieving good ratings creates meaningful differentiation. Users comparing similar businesses often choose those providing smoother experiences.
For Australian businesses competing against international brands, performance excellence provides competitive leverage offsetting brand recognition advantages larger competitors might possess.
Looking Ahead: Preparing for Continued Evolution
Core Web Vitals will continue evolving as user expectations rise and web technologies advance. Australian businesses should anticipate further threshold tightening and potential new metrics in coming years.
Emerging Metrics to Watch
Google experiments continuously with additional metrics potentially becoming Core Web Vitals in future. Time to First Byte (TTFB) measures server responsiveness and could become formalized threshold. First Contentful Paint (FCP) represents another candidate for future core status.
Responsiveness metrics may further evolve beyond INP as interaction complexity grows in modern web applications. Metrics capturing smooth scrolling or animation performance could emerge as web capabilities expand.
Preparation Strategies
Build performance culture treating speed as foundational requirement rather than optional enhancement. Educate teams about performance importance and establish processes preventing regressions.
Invest in measurement infrastructure providing continuous visibility into user experience quality. Waiting for Google Search Console to reveal problems means users already experienced poor performance.
Stay current with web performance best practices through resources like web.dev, Chrome Devs blog, and web performance communities. Performance optimization techniques evolve rapidly alongside browser capabilities.
The Continuous Journey
Core Web Vitals are not finish lines. They represent ongoing commitments to user experience excellence requiring sustained attention and investment.
The Australian businesses thriving in 2026 and beyond will be those treating performance as competitive advantage and user respect rather than technical checkbox. These businesses build faster, smoother, more responsive experiences because they recognize that exceptional performance drives business results whilst respecting users' time and patience.
Ready to transform your website's performance from liability to competitive advantage? The specialists at Maven Marketing Co. implement comprehensive Core Web Vitals optimization for Australian businesses. We do not just run PageSpeed tests and provide generic recommendations. We conduct detailed performance audits identifying specific bottlenecks affecting your metrics, implement systematic optimization addressing LCP, INP, and CLS comprehensively, establish continuous monitoring catching regressions before users experience them, and create performance budgets and processes preventing future degradation. Stop losing rankings, traffic, and conversions to competitors delivering faster experiences. Contact us today for a Core Web Vitals assessment revealing exactly where your site fails new 2026 thresholds and creating your roadmap to achieving good ratings across all metrics.

Table of contents
read more blogs

Handing the Keys to Google's AI: How to Keep Control of Your Ad Budget Inside Performance Max
Performance Max is Google's most automated campaign type, and also the one that provokes the most anxiety among Australian advertisers who have spent years developing campaign management practices that depend on visibility, control, and the ability to make deliberate, measurable changes. The anxiety has some basis. Performance Max does take more control away from the advertiser than any previous Google Ads campaign type: it chooses the placements, it selects the creative combinations, it determines the bid for each impression, and it distributes the budget across Google's inventory in ways the advertiser cannot directly specify. The part of the anxiety that is not well based is the conclusion that these constraints make Performance Max unmanageable or a blank cheque handed to Google's algorithm. Performance Max has a specific set of levers that, when correctly configured, give advertisers meaningful influence over where the budget goes, which audiences it targets, which creative assets it uses, and which conversion events it optimises toward. Understanding and using these levers is the difference between a Performance Max campaign that works within the advertiser's strategic parameters and one that wastes budget on inventory, audiences, and objectives that the business never intended to pursue.

When Customers Search on TikTok and Instagram Instead of Google — How Australian Brands Adapt
Something structurally significant has changed in how younger Australian consumers research purchases, and most Australian brands have not yet adjusted their discoverability strategy to reflect it. A proportion of the audience that would previously have opened Google to search for "best brunch spots Fitzroy" or "honest review Mecca skincare serum" is now opening TikTok or Instagram instead. They are searching within these platforms for short video content that shows them what they want to know: the actual food, the actual product, the actual experience, from people who have actually been there or used the item. This is not a marginal behaviour limited to a niche demographic. TikTok's own data has reported that a significant share of its users use the platform as a search engine, and the query patterns on Instagram's search function have expanded well beyond celebrity and hashtag discovery into product, venue, and service research. For Australian brands that have built their discoverability strategy entirely on Google organic search and Google Ads, this shift represents a gap that is growing over time as the audience that uses social platforms as primary discovery tools ages into demographics with higher purchasing power. This article covers what the shift to social search means practically, what content and account configuration signals these platforms use to surface results, and what Australian brands need to do differently to be found on TikTok and Instagram by people who are actively looking for what they offer.

How to Build a Google Business Profile That Converts Browsers Into Booked Appointments
A Google Business Profile that has been set up and left alone is doing roughly the same work as a shop front with the lights off. It confirms the business exists and provides the phone number, but it is not actively persuading a local searcher who is comparing three businesses in the search results to choose this one rather than the competitors sitting directly above and below it in the local pack. The businesses that win appointments from Google local search are not simply those that are closest to the searcher or those with the most reviews, although proximity and reviews both matter. They are the businesses that have treated their Google Business Profile as a conversion surface rather than a directory entry, and have populated every element of the profile with the specific information, imagery, and social proof that a local searcher needs to make a confident decision to book rather than keep browsing. The difference between a profile that ranks and converts and one that ranks but loses its potential customers to competitors is in the specific decisions this article covers: how to write the business description, which photos produce engagement, how to use posts to maintain freshness signals, how to respond to reviews in a way that builds rather than diminishes trust, and how to configure the booking and contact features that reduce friction between intent and appointment.


