.svg)
.svg)
.svg)


%201.svg)
Key Takeaways
- Conversion funnel analysis identifies specific stages where customer journeys break down, enabling targeted optimisation that recovers revenue from prospects who demonstrate genuine interest before abandoning
- Effective funnel mapping documents every touchpoint from initial awareness through conversion completion, revealing drop-off rates at each stage and prioritising optimisation efforts where losses are largest
- Qualitative research methods including session recordings, heatmaps, and user surveys complement quantitative funnel data by explaining why drop-offs occur rather than simply measuring that they happen
- Systematic A/B testing validates funnel optimisations through controlled experiments preventing costly changes based on incomplete evidence that sometimes worsen conversion rates despite seeming logical
- Funnel analysis generates compounding returns—small percentage improvements at high-traffic funnel stages multiply across total visitor volume, producing significant revenue recovery from modest conversion rate gains
A Melbourne e-commerce retailer selling premium homewares noticed declining revenue despite stable traffic volumes. Initial assumption pointed to increased competition or shifting consumer preferences. Standard analytics showed consistent visitor numbers, average session durations, and bounce rates. Nothing obviously wrong. Revenue decline remained unexplained.
Systematic funnel analysis revealed the actual problem immediately. Product page to cart addition rate: 18% (healthy). Cart to checkout initiation: 71% (excellent). Checkout initiation to payment entry: 68% (acceptable). Payment entry to order completion: 23% (critically low). The payment completion stage was haemorrhaging 77% of customers who had already committed to purchasing and entered payment details.
Investigation revealed that a recent website update had introduced a mobile payment processing bug affecting iOS Safari users—Australia's most common mobile browser configuration. Affected users received cryptic error messages after entering complete payment details, abandoning frustrated. The bug had existed for six weeks. Thousands of completed payment attempts had failed silently. Funnel analysis identified in one hour what six weeks of revenue decline hadn't revealed through standard reporting.
According to research from Baymard Institute, the average documented online cart abandonment rate is 70.19%, representing enormous recoverable revenue for Australian e-commerce businesses through systematic funnel analysis and optimisation.
Understanding Conversion Funnel Architecture
Effective funnel analysis requires understanding how conversion funnels are structured, what causes stage-by-stage losses, and how different business models produce distinct funnel patterns.
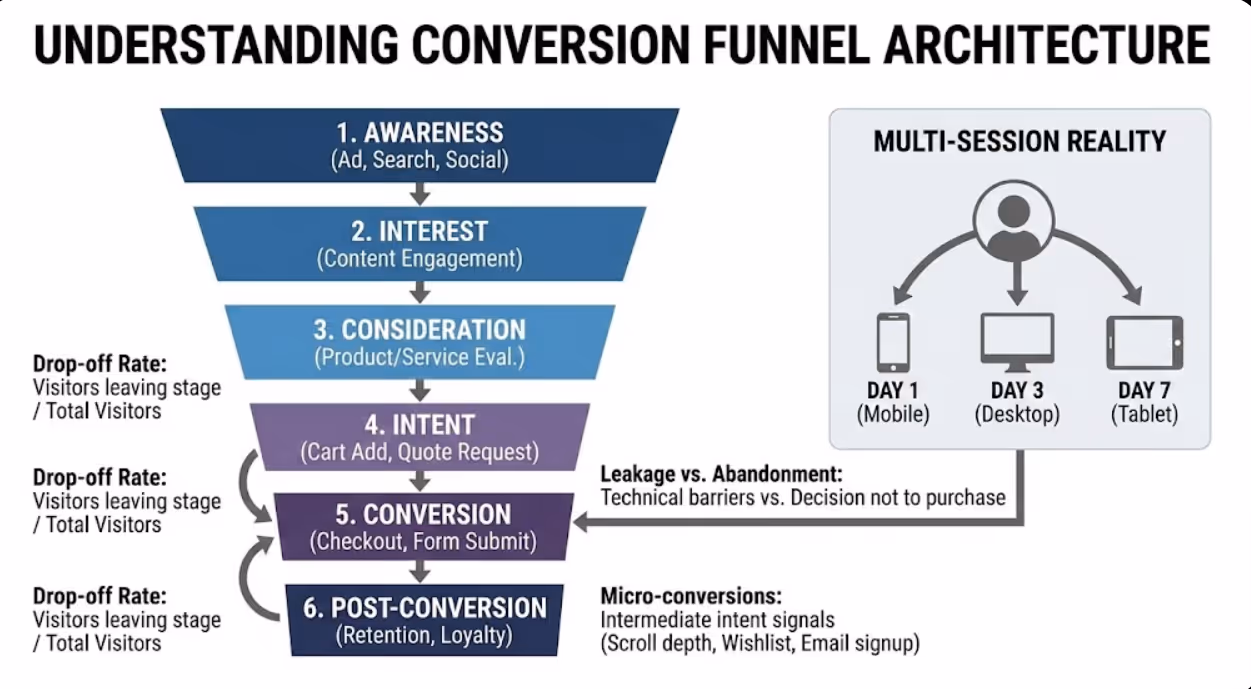
Funnel stage definitions vary by business model but follow consistent progression logic. Awareness stages capture initial prospect attention through advertising, organic search, social media, or referral. Interest stages engage visitors with relevant content demonstrating solution relevance. Consideration stages enable evaluation through product pages, service descriptions, case studies, and comparison information. Intent stages capture explicit purchase or inquiry interest through cart additions, quote requests, or contact page visits. Conversion stages complete transactions through checkout, form submission, or phone contact. Post-conversion stages generate repeat purchases, referrals, and lifetime value beyond initial transaction.
Drop-off rate calculation measures stage-by-stage conversion efficiency. Divide visitors completing each stage by visitors entering that stage—a product page receiving 1,000 visitors with 180 add-to-cart events produces 18% stage conversion rate and 82% drop-off rate. Multiply stage conversion rates to calculate full-funnel conversion—18% cart addition × 65% checkout initiation × 45% order completion = 5.3% overall conversion rate. Understanding both stage and full-funnel conversion rates enables accurate impact assessment of stage-specific optimisations.
Benchmark comparison contextualises drop-off rates against industry standards. Australian e-commerce conversion rates typically range 1-4% overall depending on product category, traffic quality, and competitive environment. Service business lead conversion rates typically range 2-8% depending on industry and offer type. Stage-specific benchmarks provide optimisation priority guidance—cart abandonment rates significantly exceeding 70% indicate checkout friction warranting immediate attention, whilst modest improvement to high-traffic early stages often delivers more total revenue than large improvements to low-traffic late stages.
Funnel leakage versus funnel abandonment requires distinction for accurate diagnosis. Leakage occurs when technically capable customers abandon due to friction—confusing interfaces, technical errors, excessive required information, or poor mobile experiences. These prospects wanted to convert but couldn't or wouldn't given specific obstacles. Abandonment occurs when prospects genuinely decide not to convert—product doesn't meet needs, price exceeds value perception, timing isn't right. Leakage is optimisable; abandonment requires deeper marketing, product, or pricing strategy responses. Accurate diagnosis prevents optimising interfaces for genuinely uninterested prospects whilst missing technical barriers blocking motivated buyers.
Micro-conversion tracking reveals intermediate commitment signals within funnel stages. Scroll depth indicates content engagement. Video play rates show interest in demonstrations. Wishlist additions signal intent without immediate purchase commitment. Email signup conversions capture prospects not ready for immediate purchase. Micro-conversions reveal prospect interest levels that drop-off rates alone obscure—high product page exit rates combined with high wishlist addition rates indicate engaged prospects deterred by something specific rather than genuine disinterest.
Multi-session funnel reality acknowledges that most B2B and considered purchases span multiple visits rather than completing within single sessions. Australian consumers purchasing major appliances, professional services, or significant software investments typically research across 3-7 sessions over days or weeks before converting. Single-session funnel analysis misses this multi-session reality—proper funnel analysis requires user-level tracking connecting behaviour across sessions to accurately measure consideration-to-conversion progression.
Funnel Mapping and Measurement Setup
Accurate funnel analysis requires systematic mapping of customer journey touchpoints and proper measurement configuration capturing stage transitions reliably.
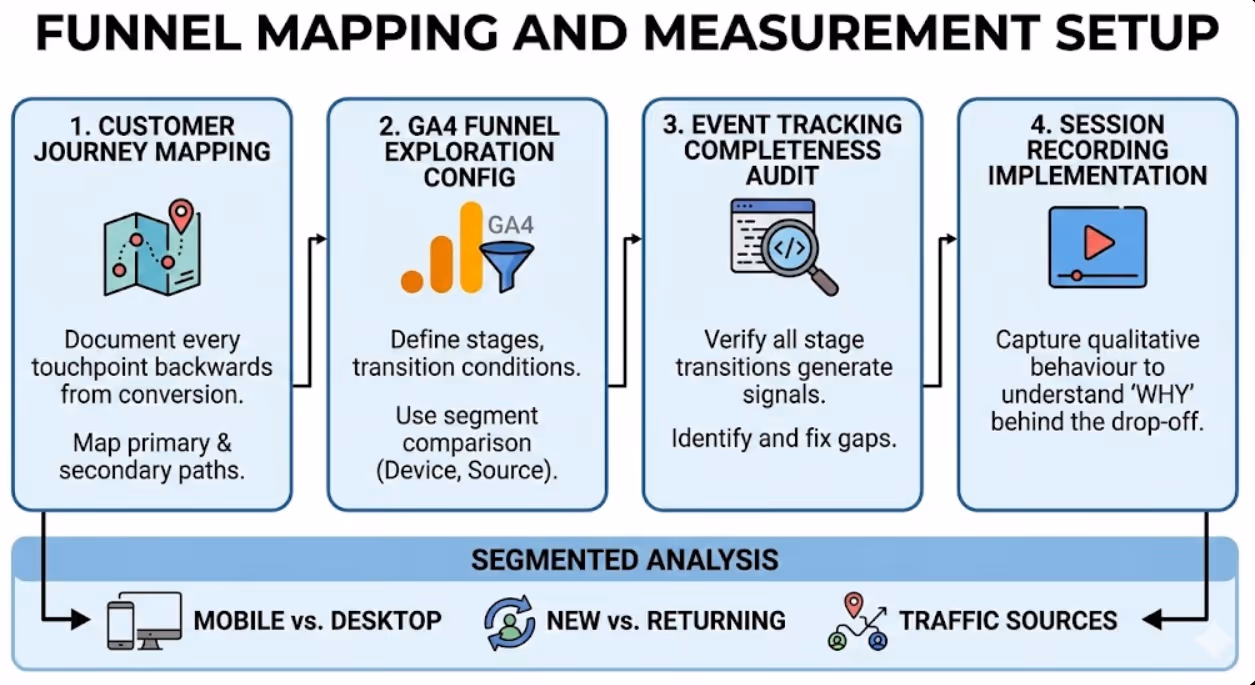
Customer journey mapping documents every significant touchpoint preceding conversion. Begin with conversion completion and work backwards identifying each decision point prospects encounter. Map primary conversion paths (most common routes customers take) alongside secondary paths (alternative journeys representing significant traffic volumes). Note all potential entry points (different landing pages, traffic sources, device types) as different entry points often produce dramatically different funnel performance requiring separate analysis. Document assumptions during mapping—gaps in journey knowledge represent measurement priorities revealing unknown drop-off points.
GA4 funnel exploration configuration provides primary quantitative funnel measurement tool. Navigate to Explore > Funnel Exploration, define funnel steps corresponding to mapped customer journey stages, specify step transition conditions (page views, event completions, or custom conditions), and configure open versus closed funnel settings (whether users can enter at any step or must start at step one). GA4's funnel exploration visualises stage-by-stage drop-off rates with segment comparison capability enabling analysis by device type, traffic source, or audience characteristic.
Event tracking completeness verification ensures all funnel stages generate trackable signals. Audit current event tracking against mapped funnel stages identifying gaps where important transitions occur without measurement. Common tracking gaps include add-to-cart events missing on some product variants, form abandonment not tracked separately from form initiation, phone click events absent from mobile pages, and checkout step transitions firing inconsistently across browsers. Incomplete tracking produces misleading funnel analysis—fixing measurement gaps before drawing optimisation conclusions prevents decisions based on incomplete data.
Conversion path analysis reveals actual routes customers take versus assumed paths. GA4's path exploration (Explore > Path Exploration) shows real navigation sequences users follow through your site, often revealing unexpected routes diverging significantly from assumed primary paths. Common discoveries include significant traffic volumes reaching checkout through unexpected entry points that receive no optimisation attention, popular page sequences not reflected in sitemap or navigation design, and high-converting alternative paths suggesting homepage-centric navigation assumptions don't reflect actual user behaviour.
Segmented funnel analysis disaggregates overall funnel performance revealing hidden variation. Analyse funnel conversion rates separately for mobile versus desktop visitors (typically significant differences), new versus returning visitors (different familiarity levels), different traffic sources (varying intent levels), geographic segments (different device preferences, language expectations), and device types (iOS versus Android sometimes show different performance). Aggregate funnel metrics frequently mask severe performance problems in specific segments that averages dilute—a 3% overall conversion rate might combine 6% desktop conversion with 1% mobile conversion requiring entirely different optimisation approaches.
Session recording implementation captures qualitative behaviour complementing quantitative funnel metrics. Tools including Hotjar, Microsoft Clarity (free), and FullStory record anonymised visitor sessions showing actual mouse movements, clicks, scrolling, and form interactions. Session recordings answer the critical question that quantitative data cannot—why are visitors dropping off? Watching 20-30 session recordings at each high-drop-off funnel stage typically reveals specific friction patterns invisible in aggregate metrics. Hotjar and Microsoft Clarity both offer free tiers providing immediate session recording access without significant tool investment.
Diagnosing Drop-Off Causes
Identifying where drop-off occurs is the first analysis stage—understanding why it occurs requires deeper diagnostic investigation combining multiple research methods.
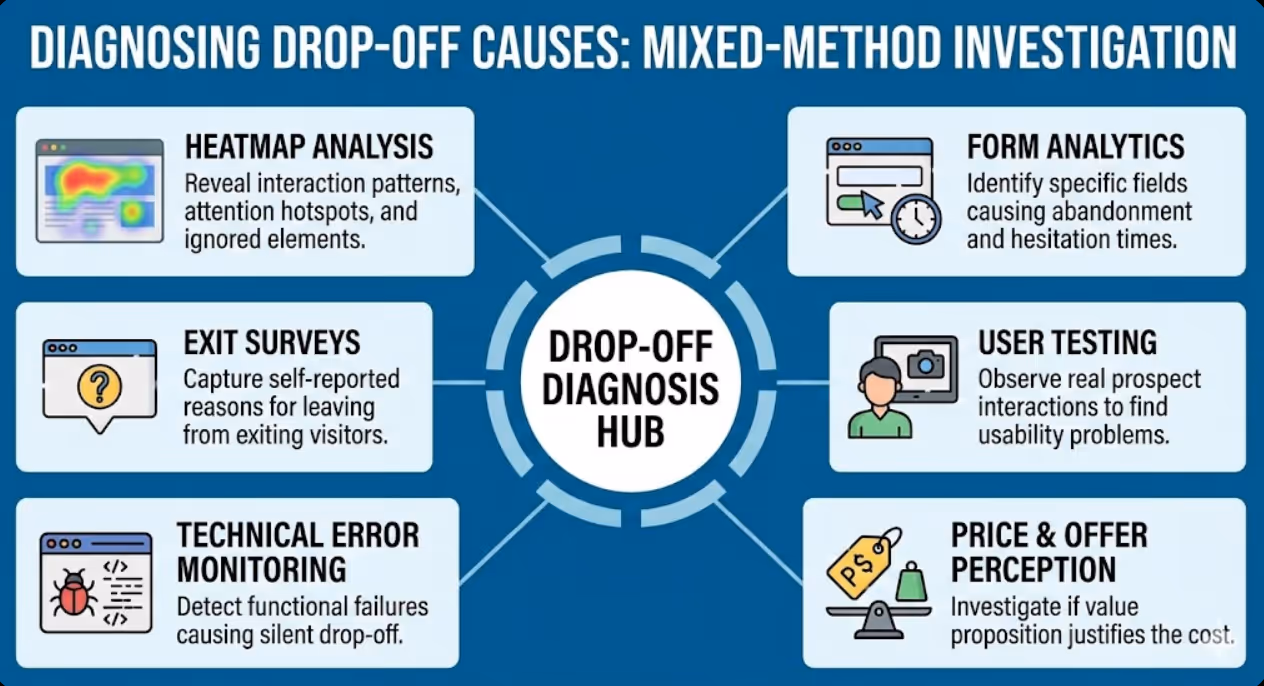
Heatmap analysis reveals aggregate interaction patterns across page elements. Click heatmaps show which elements attract most interaction, revealing whether calls-to-action receive expected engagement or whether irrelevant elements attract clicks away from conversion paths. Scroll heatmaps show how far down pages visitors typically scroll, revealing whether critical information appears below scroll depth thresholds most visitors reach. Move heatmaps (tracking mouse cursor position as proxy for visual attention) identify elements attracting visual attention without generating intended interactions. Heatmap analysis is particularly valuable for diagnosing high-exit pages within funnels—elements receiving high attention but low clicks often indicate confusing interface patterns frustrating intended interactions.
Form analytics diagnoses lead generation and checkout form abandonment specifically. Field-level analytics (available through Hotjar, Formisimo, and similar tools) reveal which specific form fields cause abandonment, how long visitors spend on each field, and where in form sequences abandonment most frequently occurs. Common diagnostic findings include phone number fields causing disproportionate abandonment (privacy concerns), company size dropdowns generating confusion (inadequate options), and card security fields (CVV) producing abandonment spikes on payment forms (security anxiety). Field-level abandonment data enables surgical form optimisation rather than broad redesigns based on overall completion rates alone.
Exit survey implementation captures self-reported abandonment reasons from actual exiting visitors. Deploy exit intent surveys (triggered when cursor moves toward browser navigation) on high drop-off pages asking single focused questions: "What prevented you completing your purchase today?" or "What information were you looking for but couldn't find?" Exit survey response rates are typically 5-15%, providing statistically meaningful qualitative data explaining quantitatively measured drop-off. Common Australian SME exit survey findings include unexpected shipping costs causing cart abandonment, inability to find specific product variants, uncertainty about delivery timeframes, and preference for phone completion rather than online forms.
User testing with Australian audiences provides structured observation of real prospect interaction with your funnel. Recruit 5-8 participants matching your target customer profile, assign specific conversion tasks (purchase specific product, request quote, book consultation), observe and record their attempts without assistance, note confusion points, hesitations, and failed interactions. Even small user testing samples reliably identify major usability problems that analytical data reveals exist but cannot explain. Australian-specific user testing occasionally reveals localisation issues—unfamiliar terminology, missing Australian payment options, or international address format assumptions creating friction for local customers.
Technical error monitoring identifies functional failures causing drop-off that user experience analysis misses. Implement JavaScript error monitoring (Sentry, Bugsnag) capturing client-side errors occurring during checkout, form submission, or other conversion processes. Review server error logs identifying 404 errors, 500 server errors, and timeout issues within conversion paths. Test checkout and lead generation forms across multiple browsers, devices, and operating systems identifying cross-browser compatibility failures. Technical errors silently cause conversion drop-off without producing user complaints—affected users simply leave rather than reporting problems. The Melbourne e-commerce case study opening this article exemplifies technical error monitoring's importance for diagnosing unexplained conversion declines.
Price and offer perception analysis investigates whether conversion barriers reflect value perception rather than interface problems. Competitive price comparison reveals whether pricing sits within acceptable ranges for Australian market conditions. Value proposition clarity analysis assesses whether benefit communication adequately justifies price points. Shipping cost and timeline transparency evaluation examines whether hidden costs revealed late in checkout create abandonment spikes. Guarantee and trust signal adequacy assessment determines whether risk-reduction elements sufficiently address purchase hesitancy. Sometimes funnel drop-off reflects genuine product-market fit or pricing problems that interface optimisation cannot solve—accurate diagnosis prevents wasted optimisation investment on fundamentally uncompetitive offers.
E-Commerce Funnel Optimisation Strategies
E-commerce funnels follow predictable patterns enabling targeted optimisation strategies addressing most common Australian drop-off causes.
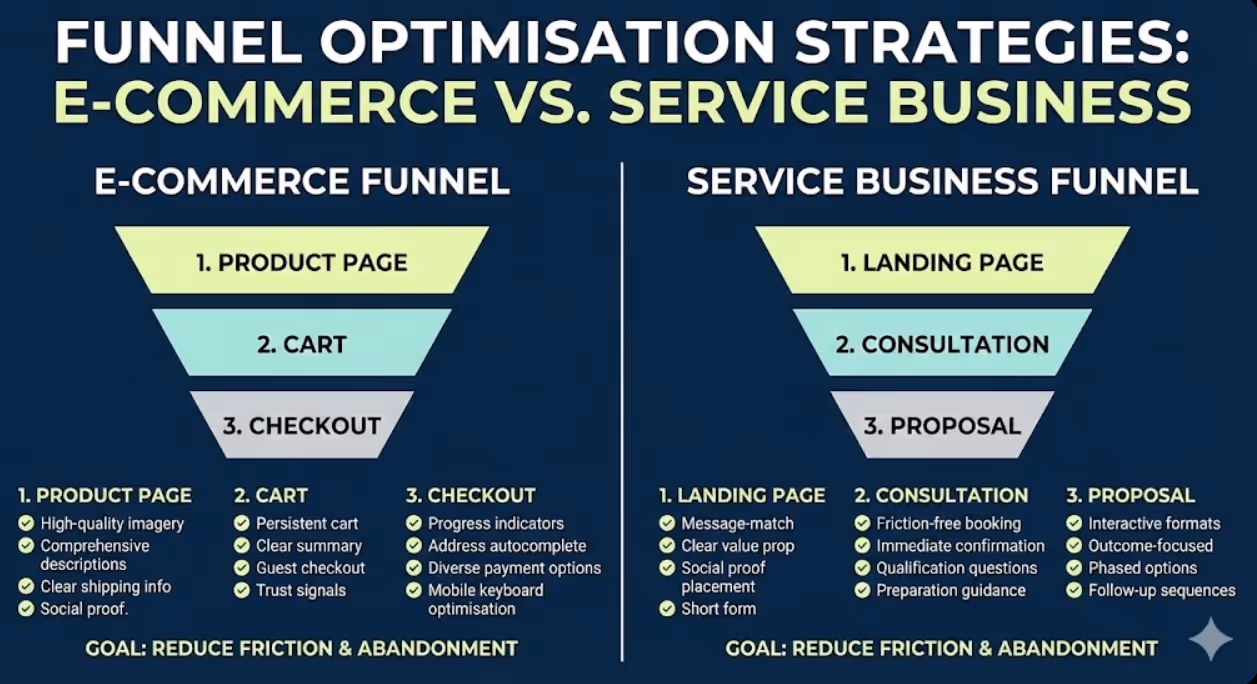
Product page optimisation improves add-to-cart conversion rates from the critical consideration stage. High-quality product imagery (multiple angles, zoom capability, lifestyle context) reduces uncertainty about physical products Australian consumers can't examine before purchase. Comprehensive product descriptions addressing common questions eliminate research abandonment. Prominent shipping cost and delivery timeline information prevents checkout-stage surprise abandonment. Social proof through ratings and reviews reduces purchase risk perception. Stock availability transparency creates urgency without false scarcity manipulation. Australian-specific considerations include displaying prices in AUD prominently, providing Australian delivery timeline estimates, and featuring Australian customer reviews alongside international ones.
Cart optimisation reduces abandonment between product selection and checkout initiation. Persistent cart functionality saves selections across sessions for multi-visit purchase journeys. Cart summary clarity showing products, quantities, prices, and total costs prevents confusion driving abandonment. Saved-for-later functionality retains non-immediate purchase intent without forcing immediate commitment. Guest checkout options eliminate registration friction that causes significant abandonment among first-time buyers. Trust signals (security badges, SSL indicators, return policies) within cart view address anxiety preceding the commitment of initiating checkout. According to Baymard Institute research, forcing account creation before purchase causes 24% of checkout abandonment—guest checkout implementation alone typically recovers substantial conversion losses.
Checkout flow optimisation addresses the highest-stakes funnel stage where motivated purchasers abandon. Progress indicators show checkout completion status reducing uncertainty about remaining steps. Address form optimisation includes Australian address format support, postcode-to-suburb autocomplete, and state dropdown reflecting Australian states and territories. Payment method diversity accommodates Australian consumer preferences—credit cards, debit cards, PayPal, Afterpay, Zip Pay, and Apple/Google Pay collectively cover most Australian payment preferences. Mobile keyboard optimisation ensures appropriate input types appear for numeric fields (card numbers, CVV, postcodes). Order summary visibility throughout checkout prevents abandonment from uncertainty about what's being purchased.
Abandoned cart recovery recaptures drop-off that optimisation cannot entirely eliminate. Email sequences targeting identified customers who abandoned carts with personalised recovery messaging, relevant product imagery, and clear return-to-cart pathways recover 5-15% of abandoned carts through well-designed recovery programmes. SMS recovery for customers who've provided mobile numbers achieves higher open rates than email for time-sensitive offers. Exit intent overlays offering assistance, answering common objections, or providing discount incentives recover some anonymous cart abandoners before they leave. Recovery mechanisms complement funnel optimisation—reducing drop-off rates whilst recovering remaining abandonment through systematic follow-up.
Service Business and Lead Generation Funnel Optimisation
Service businesses and lead generation funnels follow different patterns from e-commerce, requiring distinct optimisation approaches reflecting longer consideration periods and offline conversion completion.
Landing page conversion optimisation addresses the critical stage where paid and organic traffic either converts to inquiry or bounces without engaging. Message-match between traffic source (ad copy, search query, email subject) and landing page headline prevents immediate abandonment from expectation violation. Above-fold value proposition clarity communicates what service solves, for whom, and what makes your approach distinctively valuable within seconds of arrival. Social proof placement near conversion forms reduces commitment hesitancy precisely when it peaks. Form length minimisation for initial contact (name, email, one qualifying question) improves completion rates over comprehensive intake forms better suited to post-qualification stages.
Consultation and discovery call conversion bridges online inquiry to sales conversation—often the most critical funnel transition for Australian professional services. Friction-free booking through integrated scheduling tools (Calendly, Acuity Scheduling) removes email tag and phone tag barriers that lose motivated prospects during scheduling. Immediate confirmation with clear next-step instructions prevents prospect uncertainty about what happens after inquiry submission. Qualification question integration during booking screens misaligned prospects whilst gathering context enabling more valuable initial conversations. Preparation guidance (what to have ready, what to expect) increases consultation attendance rates from booked prospects who otherwise no-show.
Proposal to engagement conversion addresses high drop-off rates at the final service business funnel stage where proposals fail to close. Proposal delivery through interactive formats (web-based proposals, PDF with embedded video) rather than static documents improves engagement and comprehension. Clear, specific outcome articulation emphasising measurable results rather than service features addresses B2B decision-maker priorities. Phased engagement options reducing initial commitment barriers (discovery project, pilot engagement, month-to-month versus annual commitment) provide lower-risk entry points for hesitant prospects. Follow-up sequences maintaining proposal visibility through tactful check-ins prevent proposals from being forgotten amid competing priorities.
Multi-touchpoint attribution for service business funnels acknowledges that conversion credit belongs across multiple sessions and channels. A prospect might discover your business through organic search, return via LinkedIn content, attend a webinar, download a guide, then submit an inquiry six weeks after first visit. Last-click attribution assigns all conversion credit to the final touchpoint, systematically undervaluing awareness and consideration content. Multi-touch attribution models distributing credit across journey touchpoints reveal accurate channel contribution, preventing defunding of awareness channels that appear non-converting under last-click attribution but actually initiate journeys that eventually convert.
A/B Testing Funnel Optimisations
Systematic testing validates that identified optimisations actually improve conversion rather than implementing changes based on plausible but potentially incorrect hypotheses.
Test prioritisation frameworks focus limited testing resources on highest-impact opportunities. ICE scoring (Impact × Confidence × Ease) rates potential tests across these three dimensions, prioritising high-impact, high-confidence, easily implemented tests over low-impact or technically complex experiments. PIE scoring (Potential × Importance × Ease) provides alternative framework weighting potential improvement, page importance to overall conversion, and implementation ease. Both frameworks prevent common mistake of testing minor elements (button colours, background shades) before major elements (headline copy, form length, page layout) that typically produce larger conversion impacts.
Statistical significance requirements prevent premature conclusions from insufficient data. Most A/B testing tools calculate statistical significance automatically—require minimum 95% confidence before declaring test winners, ensuring observed differences reflect genuine performance rather than random variation. Statistical significance requires sufficient sample size—typically minimum 100 conversions per variation rather than just traffic volume. Running tests for insufficient duration (less than one complete business cycle) introduces day-of-week and time-of-day variation that distorts results. Patience in testing produces reliable conclusions that premature test endings frequently invalidate.
Isolation principle tests single variables enabling accurate attribution of performance differences. Testing headline copy and form length simultaneously prevents determining which change drove results—both might have improved conversion but in opposing directions, or one improved whilst the other harmed. Single-variable testing enables learning that informs future tests beyond immediate winner/loser determination. Exception: multivariate testing with sufficient traffic enables simultaneous testing of multiple variables with statistical validity—but requires substantially higher traffic volumes than simple A/B tests, limiting applicability for many Australian SMEs.
Losing test learning extracts value from experiments confirming current approaches outperform alternatives. Document losing test hypotheses and results—understanding that longer product descriptions don't improve conversion for your audience informs future testing strategy and prevents repeatedly testing similar approaches. Losing tests sometimes reveal unexpected patterns in segment-specific performance—a test losing on aggregate might win significantly for mobile users, revealing segment-specific optimisation opportunities. Systematic test documentation builds institutional knowledge that compounds into progressively more sophisticated optimisation programmes over time.
Measuring Funnel Optimisation Impact
Rigorous measurement connects optimisation activities to business outcomes justifying ongoing investment.
Revenue impact calculation quantifies optimisation financial returns. Calculate current funnel revenue: (monthly visitors) × (overall conversion rate) × (average order/contract value). Apply optimisation improvement to relevant stage and recalculate. A 2% improvement in checkout completion rate for a business processing 500 monthly checkouts at $250 average order value generates $2,500 additional monthly revenue—$30,000 annually from single-stage optimisation. Revenue impact calculation transforms abstract conversion rate percentages into concrete business justification for optimisation investment.
Compounding improvement tracking measures cumulative impact across sequential optimisations. Document baseline conversion rates before optimisation programme commencement, record conversion rate after each significant optimisation, and calculate cumulative improvement from series of incremental gains. Multiple small improvements compound significantly—5% improvement in three sequential funnel stages produces 15.76% overall improvement ((1.05 × 1.05 × 1.05) - 1), demonstrating that systematic incremental optimisation outperforms searching for single dramatic improvements.
Segmented improvement analysis reveals whether optimisations improve performance across all visitor segments or primarily benefit specific groups. Optimisations improving mobile conversion without affecting desktop performance should be evaluated against mobile traffic proportion. Channel-specific improvements should be weighted by channel traffic volume. Segment-level analysis prevents celebrating optimisations benefiting small visitor segments whilst missing opportunities in larger segments driving most revenue.
Frequently Asked Questions
Where should Australian businesses start when approaching conversion funnel analysis for the first time without existing measurement infrastructure?
Begin with measurement before optimisation—attempting funnel analysis without reliable data produces unreliable conclusions. Initial infrastructure setup should include GA4 with properly configured conversion events (form submissions, purchases, phone clicks), session recording tool (Microsoft Clarity is free and provides immediate value), and basic heatmap capability for highest-traffic pages. With measurement in place, identify your highest-traffic conversion path through GA4 acquisition reporting, map that specific journey from entry to conversion, configure GA4 funnel exploration for those specific steps, and identify the single stage showing highest drop-off rate. That highest-drop-off stage becomes your first optimisation priority. Starting with highest-impact opportunity rather than comprehensive programme development produces faster initial results justifying expanded investment.
How do you distinguish between funnel drop-off caused by genuine disinterest versus technical or experience barriers that optimisation can fix?
Distinguishing disinterest from fixable friction requires combining multiple data signals rather than relying on single metrics. Signals suggesting genuine disinterest include high bounce rates combined with low engagement metrics (short session duration, minimal page scrolling), traffic from misaligned sources (broad awareness campaigns attracting irrelevant audiences), and consistent drop-off patterns unchanged across device types and traffic sources. Signals suggesting fixable friction include high engagement before drop-off (visitors spending significant time on page before abandoning), mobile-specific drop-off rates significantly exceeding desktop rates (platform-specific problems rather than audience disinterest), drop-off increases following recent site changes (suggesting new friction introduction), and exit survey responses mentioning specific barriers rather than disinterest. The most reliable diagnosis combines quantitative pattern analysis with qualitative session recording review—watching actual visitors encounter specific friction points is more definitive than inferring causes from metrics alone.
What sample sizes do Australian SMEs need before funnel analysis produces reliable insights, and how should low-traffic businesses approach optimisation?
Reliable quantitative funnel analysis typically requires minimum 500-1,000 visitors per funnel stage per analysis period, with conversion events needing minimum 50-100 completions for statistically meaningful rate calculation. Low-traffic businesses (under 500 monthly visitors) face genuine quantitative analysis challenges—small sample sizes produce highly variable metrics where week-to-week fluctuation reflects randomness rather than meaningful patterns. Low-traffic businesses should extend analysis periods (quarterly rather than monthly analysis), prioritise qualitative methods that provide valuable insights from small samples (10-20 session recordings reveal major usability problems regardless of overall traffic volume, 5-8 user testing participants reliably identify critical friction points), focus on removing obviously significant barriers rather than testing incremental improvements requiring large samples to detect, and invest in traffic growth enabling more reliable future quantitative analysis.
How frequently should Australian businesses conduct conversion funnel analysis, and what triggers should prompt immediate investigation outside regular review cycles?
Regular funnel analysis cadences include weekly monitoring of conversion rates across primary funnel stages (detecting sudden drops indicating technical failures), monthly deeper analysis examining stage-by-stage performance trends and optimisation impact measurement, and quarterly comprehensive reviews incorporating qualitative research updates, competitive analysis, and strategic optimisation prioritisation. Immediate investigation triggers include conversion rate drops exceeding 20% from previous period without corresponding traffic quality changes (suggesting technical failures or significant UX problems), sudden mobile-specific conversion decline (indicating mobile experience issues), payment completion drops following any site update (payment processing bugs are common post-update), and significant traffic source mix changes altering overall funnel performance through audience quality shifts.
Should Australian businesses optimise for conversion rate or revenue per visitor, and how does this distinction affect funnel optimisation priorities?
Revenue per visitor (RPV) provides more complete optimisation target than conversion rate alone, particularly for e-commerce businesses where average order value varies significantly across customer segments. Optimisations improving conversion rates can reduce RPV if they primarily convert lower-value purchasers whilst discouraging premium purchases—aggressive discount promotions might improve conversion rate whilst reducing average order value, potentially reducing total revenue despite more transactions. Calculate RPV (total revenue divided by total visitors) as primary optimisation metric, then decompose into conversion rate and average order value components understanding whether optimisation opportunities lie in converting more visitors, encouraging higher-value purchases, or both. Service businesses typically focus on lead quality alongside lead volume—conversion rate optimisation producing more unqualified leads increases sales team workload without proportional revenue improvement.
How should Australian e-commerce businesses prioritise between reducing cart abandonment versus improving product page conversion when both show significant optimisation opportunities?
Prioritisation depends on where absolute visitor volumes and revenue losses are largest rather than which percentage improvements seem most achievable. Calculate total revenue impact at each stage: if 10,000 monthly visitors produce 800 product page add-to-carts (8% conversion) and 320 completed purchases (40% of cart additions), improving product page conversion 2% generates 200 additional cart additions monthly whilst improving cart-to-purchase conversion 10% generates 80 additional completed purchases. With $150 average order value, the product page improvement generates $30,000 monthly additional revenue potential versus cart improvement's $12,000—despite the cart improvement representing larger percentage gain. Always calculate absolute revenue impact rather than comparing percentage improvements across funnel stages with dramatically different visitor volumes.
How do Australian businesses use funnel analysis insights when the data reveals problems that require significant development investment to fix?
Business case development translates funnel analysis findings into investment justifications connecting identified problems to revenue impact. Calculate monthly revenue loss from identified drop-off: if fixing a specific checkout bug could recover 15% of abandoned checkouts representing $25,000 monthly revenue, the business case justifies $50,000 development investment with two-month payback period. Prioritise fixes by revenue impact, implementation cost, and technical complexity—not all identified problems warrant immediate expensive fixes. Interim solutions sometimes address drop-off whilst permanent fixes are developed—simplifying checkout flow, adding trust signals, or improving error messaging can reduce drop-off whilst underlying technical problems are resolved through proper development. Staged fix implementation (highest-impact, lowest-cost fixes first) generates early wins demonstrating funnel analysis ROI whilst building momentum for larger development investments.
Funnel Analysis Drives Systematic Revenue Recovery
Conversion funnel analysis transforms revenue optimisation from intuition-based guesswork into systematic evidence-driven improvement, identifying precisely where Australian businesses lose motivated prospects and what changes recover those losses most effectively.
The analytical frameworks outlined in this guide—funnel mapping, quantitative measurement, qualitative diagnosis, targeted optimisation, and rigorous testing—provide comprehensive approach to funnel improvement that compounds incremental gains into significant revenue recovery across sustained optimisation programmes.
Australian businesses implementing systematic funnel analysis consistently discover that most revenue recovery opportunities exist within current traffic rather than requiring additional marketing investment—improving how existing visitors convert generates immediate returns without proportional cost increases.
Ready to identify and fix the conversion drop-off points costing your Australian business revenue? Maven Marketing Co. provides comprehensive conversion funnel analysis, optimisation strategy, and implementation support ensuring your digital assets convert the traffic you're already attracting into measurable business results. Let's recover the revenue your funnel is currently losing.

Table of contents
read more blogs

Handing the Keys to Google's AI: How to Keep Control of Your Ad Budget Inside Performance Max
Performance Max is Google's most automated campaign type, and also the one that provokes the most anxiety among Australian advertisers who have spent years developing campaign management practices that depend on visibility, control, and the ability to make deliberate, measurable changes. The anxiety has some basis. Performance Max does take more control away from the advertiser than any previous Google Ads campaign type: it chooses the placements, it selects the creative combinations, it determines the bid for each impression, and it distributes the budget across Google's inventory in ways the advertiser cannot directly specify. The part of the anxiety that is not well based is the conclusion that these constraints make Performance Max unmanageable or a blank cheque handed to Google's algorithm. Performance Max has a specific set of levers that, when correctly configured, give advertisers meaningful influence over where the budget goes, which audiences it targets, which creative assets it uses, and which conversion events it optimises toward. Understanding and using these levers is the difference between a Performance Max campaign that works within the advertiser's strategic parameters and one that wastes budget on inventory, audiences, and objectives that the business never intended to pursue.

When Customers Search on TikTok and Instagram Instead of Google — How Australian Brands Adapt
Something structurally significant has changed in how younger Australian consumers research purchases, and most Australian brands have not yet adjusted their discoverability strategy to reflect it. A proportion of the audience that would previously have opened Google to search for "best brunch spots Fitzroy" or "honest review Mecca skincare serum" is now opening TikTok or Instagram instead. They are searching within these platforms for short video content that shows them what they want to know: the actual food, the actual product, the actual experience, from people who have actually been there or used the item. This is not a marginal behaviour limited to a niche demographic. TikTok's own data has reported that a significant share of its users use the platform as a search engine, and the query patterns on Instagram's search function have expanded well beyond celebrity and hashtag discovery into product, venue, and service research. For Australian brands that have built their discoverability strategy entirely on Google organic search and Google Ads, this shift represents a gap that is growing over time as the audience that uses social platforms as primary discovery tools ages into demographics with higher purchasing power. This article covers what the shift to social search means practically, what content and account configuration signals these platforms use to surface results, and what Australian brands need to do differently to be found on TikTok and Instagram by people who are actively looking for what they offer.

How to Build a Google Business Profile That Converts Browsers Into Booked Appointments
A Google Business Profile that has been set up and left alone is doing roughly the same work as a shop front with the lights off. It confirms the business exists and provides the phone number, but it is not actively persuading a local searcher who is comparing three businesses in the search results to choose this one rather than the competitors sitting directly above and below it in the local pack. The businesses that win appointments from Google local search are not simply those that are closest to the searcher or those with the most reviews, although proximity and reviews both matter. They are the businesses that have treated their Google Business Profile as a conversion surface rather than a directory entry, and have populated every element of the profile with the specific information, imagery, and social proof that a local searcher needs to make a confident decision to book rather than keep browsing. The difference between a profile that ranks and converts and one that ranks but loses its potential customers to competitors is in the specific decisions this article covers: how to write the business description, which photos produce engagement, how to use posts to maintain freshness signals, how to respond to reviews in a way that builds rather than diminishes trust, and how to configure the booking and contact features that reduce friction between intent and appointment.


