.svg)
.svg)
.svg)


%201.svg)

Key Takeaways
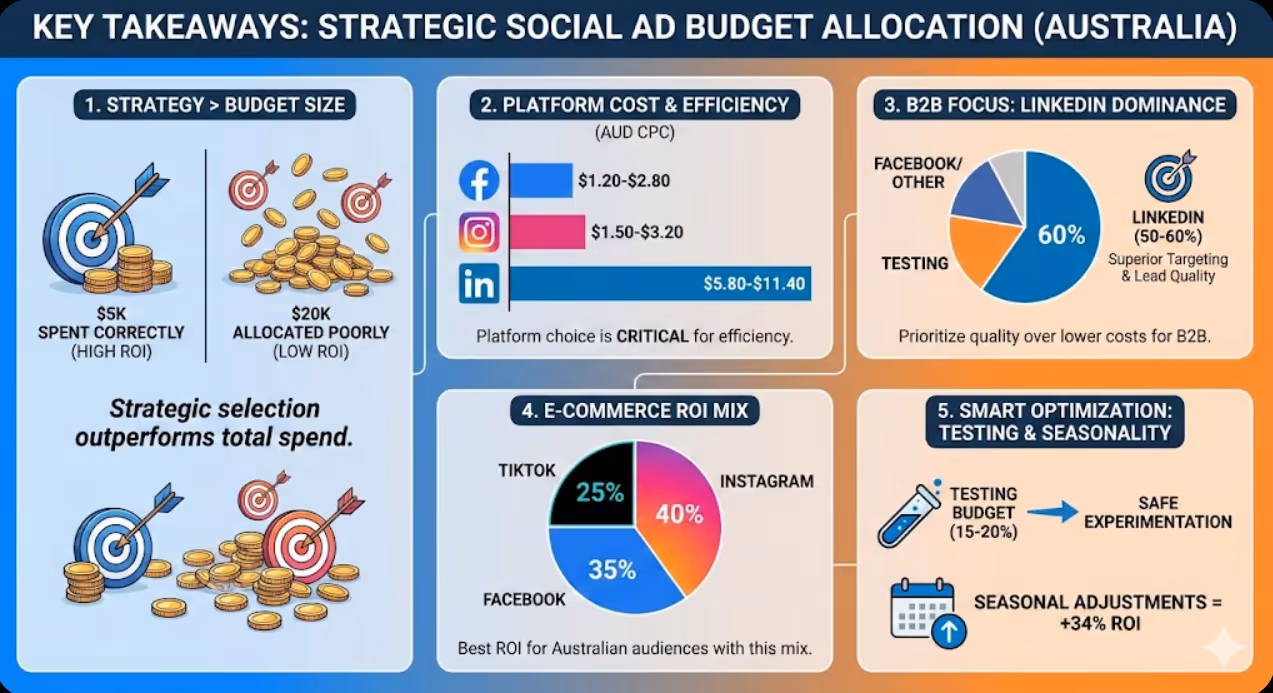
- Strategic platform selection matters more than total budget size—$5,000 spent correctly outperforms $20,000 allocated poorly
- Australian Facebook ad costs average $1.20-$2.80 per click, Instagram $1.50-$3.20, LinkedIn $5.80-$11.40, making platform choice critical for budget efficiency
- B2B businesses should allocate 50-60% of social ad budgets to LinkedIn despite higher costs due to superior targeting and conversion quality
- E-commerce brands achieve best ROI with 40% Instagram, 35% Facebook, 25% TikTok allocation for Australian audiences
- Testing budgets (15-20% of total) allow platform experimentation without jeopardizing core campaign performance
- Seasonal adjustment strategies can improve campaign ROI by 34% compared to static year-round allocation
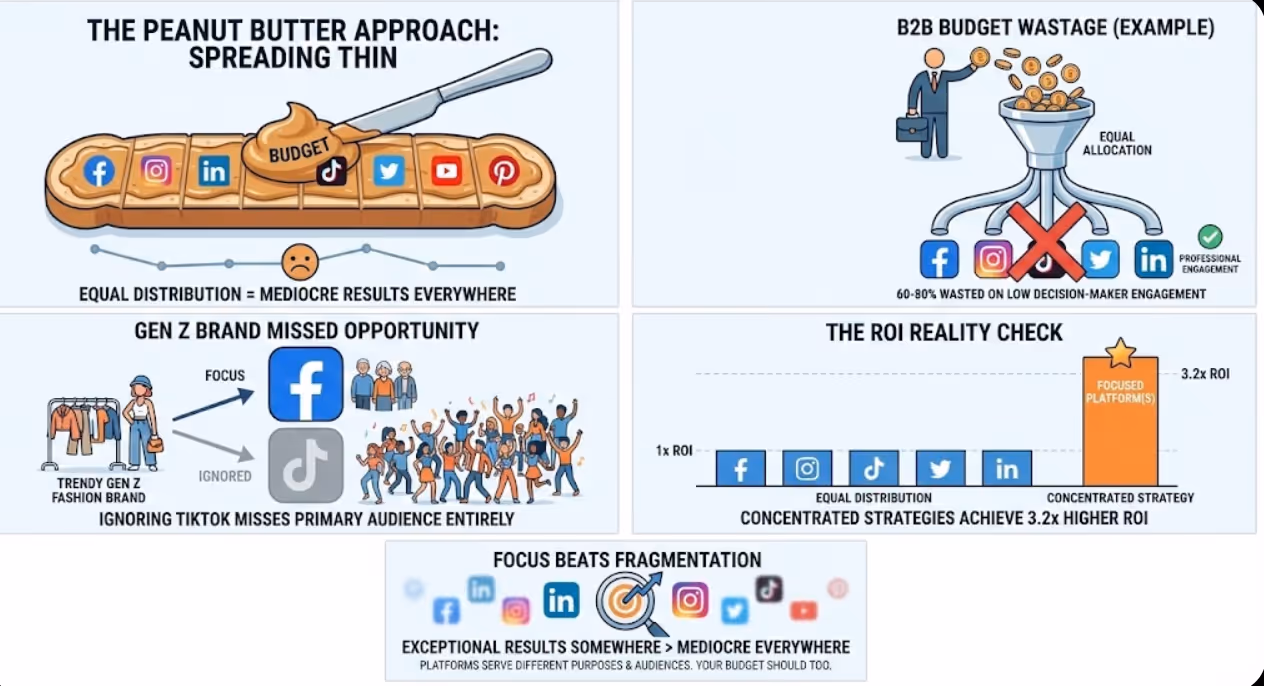
The Fatal Flaws of Equal Budget Distribution
The most common budget allocation mistake Australian businesses make is spreading their advertising dollars equally across all platforms. This "peanut butter approach"—spreading thin everywhere—seems fair but delivers mediocre results everywhere instead of exceptional results somewhere.
Different platforms serve different purposes, reach different audiences, and deliver different ROI. Your customers aren't evenly distributed across all platforms, so your budget shouldn't be either.
A B2B professional services firm advertising equally across Facebook, Instagram, LinkedIn, TikTok, and Twitter wastes 60-80% of their budget on platforms where decision-makers barely engage professionally. Meanwhile, a Gen Z fashion brand ignoring TikTok to focus on Facebook misses their primary audience entirely.
Research on social media advertising effectiveness shows businesses with concentrated platform strategies achieve 3.2x higher ROI than those distributing budgets equally across multiple platforms. Focus beats fragmentation.
Understanding Your Business Type and Objectives
Before allocating a single dollar, clarify your business type and primary advertising objectives. These fundamentals determine optimal platform allocation.
B2B Service Businesses
Professional services, SaaS companies, consultancies, and B2B enterprises prioritize lead quality over volume. Your ideal allocation typically looks like:
- LinkedIn: 50-60% - Premium targeting of job titles, industries, company sizes justifies higher costs
- Facebook: 25-30% - Retargeting and awareness campaigns at lower cost
- YouTube: 10-15% - Thought leadership and educational content
- Testing budget: 5-10% - Experimental platforms
LinkedIn's higher costs ($5.80-$11.40 CPC for Australian campaigns) become irrelevant when a single B2B client generates $50,000-$500,000 lifetime value. You need quality leads, not maximum volume.
E-Commerce and Retail
Product-based businesses prioritize conversions and ROAS (return on ad spend). Optimal allocation:
- Instagram: 35-40% - Visual product showcase, shopping features, high purchase intent
- Facebook: 30-35% - Broad reach, detailed targeting, conversion optimization
- TikTok: 20-25% - Young audiences, viral potential, trend-driven discovery
- Pinterest: 5-10% - High purchase intent, longer consideration cycles
- Testing budget: 5% - Platform experiments
Australian e-commerce businesses report average ROAS of 4.2:1 on Instagram, 3.8:1 on Facebook, and 5.1:1 on TikTok (though with smaller scale).
Local Service Businesses
Restaurants, fitness studios, salons, and local service providers need geographic precision and immediate action. Recommended allocation:
- Facebook: 45-50% - Precise local targeting, lower costs, mature ad platform
- Instagram: 35-40% - Visual appeal, Stories ads, local discovery
- Google Local Services: 10-15% - High intent, though technically not social media
- Testing budget: 5% - Platform experiments
Local businesses benefit from Facebook and Instagram's sophisticated geographic targeting combined with lower costs compared to LinkedIn or highly competitive Google search.
Content Creators and Personal Brands
Influencers, coaches, consultants, and personal brands prioritize audience building and engagement. Strategic allocation:
- Instagram: 40-45% - Core platform for most personal brands, high engagement
- Facebook: 20-25% - Retargeting, community building via Groups
- YouTube: 20-25% - Long-form content, educational positioning
- LinkedIn: 10-15% - Professional credibility, B2B positioning
- Testing budget: 5% - Platform experiments
Personal brands require presence across platforms where their specific audience concentrates, making testing budget particularly important for discovering unexpected opportunities.
Platform-Specific Australian Cost Benchmarks
Understanding realistic cost expectations prevents budget shock and enables accurate forecasting.
Facebook Advertising Costs
Australian Benchmarks (2026):
- Cost per click (CPC): $1.20-$2.80
- Cost per 1,000 impressions (CPM): $8.50-$18.00
- Cost per lead: $12.00-$45.00 (varies dramatically by industry)
- Cost per acquisition: $35.00-$180.00
Facebook remains the most cost-effective platform for reaching broad Australian audiences, particularly 35+ demographics. The mature advertising platform offers sophisticated targeting, extensive creative formats, and comprehensive optimization tools.
Budget allocation efficiency: High volume campaigns ($2,000+ monthly) achieve better cost efficiency than small budgets due to algorithm learning and optimization requirements.
Instagram Advertising Costs
Australian Benchmarks (2026):
- Cost per click (CPC): $1.50-$3.20
- Cost per 1,000 impressions (CPM): $10.00-$22.00
- Cost per lead: $15.00-$55.00
- Cost per acquisition: $45.00-$200.00
Instagram skews younger (65% of Australian users under 35) and delivers exceptional performance for visual products, lifestyle brands, and e-commerce. Stories and Reels ads often outperform feed placements for younger audiences.
Budget recommendation: Minimum $1,500 monthly for meaningful results; $3,000+ for optimization at scale.
LinkedIn Advertising Costs
Australian Benchmarks (2026):
- Cost per click (CPC): $5.80-$11.40
- Cost per 1,000 impressions (CPM): $28.00-$65.00
- Cost per lead: $55.00-$180.00
- Cost per acquisition: $180.00-$850.00
LinkedIn's premium costs reflect premium audiences—decision-makers, professionals, and B2B buyers. According to LinkedIn advertising research, Australian B2B campaigns generate 2.8x higher lead quality scores than Facebook despite 4-5x higher costs.
Budget recommendation: Minimum $2,500 monthly; $5,000+ optimal for consistent delivery and learning.
TikTok Advertising Costs
Australian Benchmarks (2026):
- Cost per click (CPC): $0.80-$2.20
- Cost per 1,000 impressions (CPM): $6.00-$14.00
- Cost per acquisition: $25.00-$120.00
TikTok offers remarkable value for reaching Australian users under 30. The platform's algorithm delivers impressive reach at competitive costs, though conversion tracking and attribution remain less sophisticated than Meta platforms.
Budget recommendation: Minimum $1,000 monthly; creative production costs often exceed media costs as platform demands native-feeling content.
YouTube Advertising Costs
Australian Benchmarks (2026):
- Cost per view (CPV): $0.08-$0.25
- Cost per 1,000 impressions (CPM): $12.00-$28.00
- Cost per acquisition: $40.00-$220.00
YouTube excels for educational content, product demonstrations, and brand building through longer-form storytelling. Australian audiences show high engagement with video content, particularly tutorial and review formats.
Budget recommendation: Minimum $1,500 monthly; video production represents significant additional investment beyond media costs.
Twitter/X Advertising Costs
Australian Benchmarks (2026):
- Cost per click (CPC): $1.80-$4.20
- Cost per 1,000 impressions (CPM): $15.00-$35.00
- Cost per acquisition: $60.00-$280.00
Twitter's smaller Australian user base and declining advertiser demand create competitive opportunities, though reach limitations constrain scalability. Best for real-time marketing, news-related brands, and niche professional audiences.
Budget recommendation: $800-$1,500 monthly for testing; avoid as primary platform unless audience concentration justifies investment.
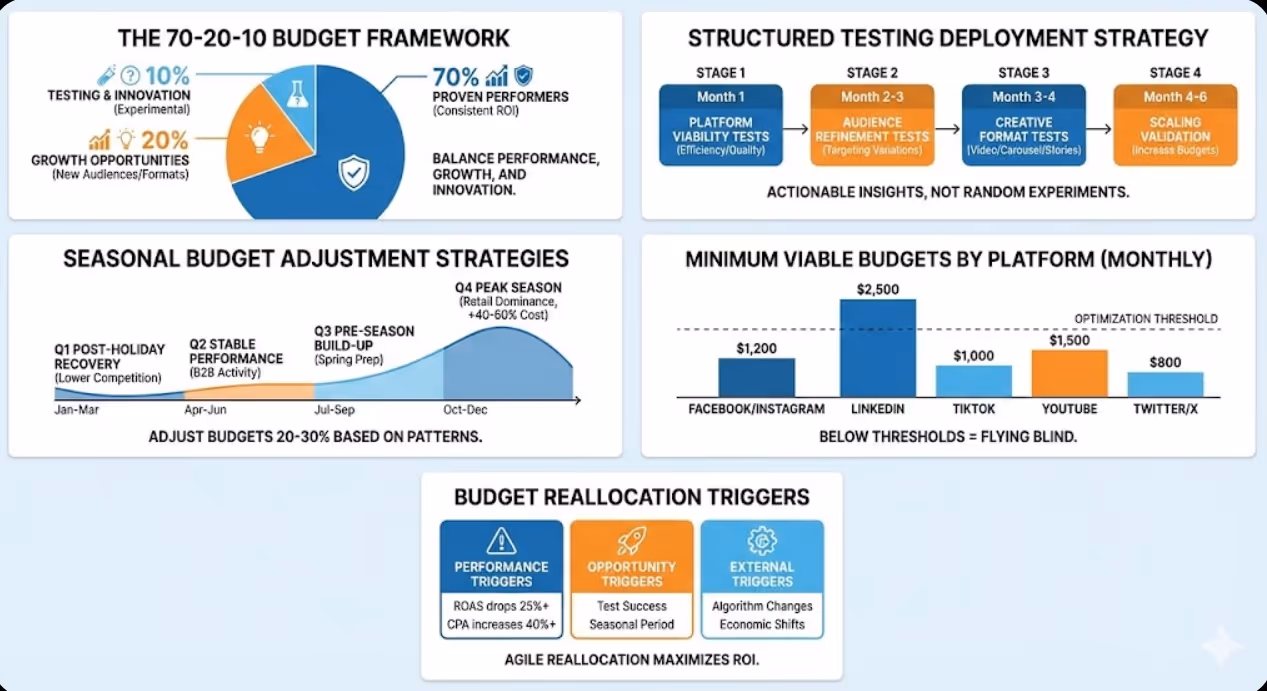
The 70-20-10 Budget Allocation Framework
This proven framework balances performance, growth, and innovation across your social advertising investment.
70% - Proven Performers
Allocate 70% of your budget to platforms and campaigns with demonstrated ROI. These are your workhorses—delivering consistent results based on historical performance data.
For most Australian businesses, this means Facebook and Instagram campaigns targeting audiences that have already converted, using creative formats proven to perform, and optimizing toward metrics directly tied to business outcomes.
This allocation ensures core business objectives are met consistently while providing stable performance baseline.
20% - Growth Opportunities
Dedicate 20% to expanding successful approaches—new audience segments on proven platforms, additional products or services, geographic expansion, or scaled creative variations.
This growth allocation pushes boundaries without excessive risk. You're expanding what works rather than experimenting blindly.
10% - Testing and Innovation
Reserve 10% for genuine experimentation—new platforms, unproven creative approaches, emerging formats, or unconventional targeting strategies.
This testing budget allows discovery of breakthrough opportunities without jeopardizing core performance. Successful tests graduate to growth or proven allocations; failures are killed quickly without major budget impact.
Seasonal Budget Adjustment Strategies
Static budget allocation ignores the reality that audience behavior and campaign performance fluctuate seasonally.
Australian Seasonal Patterns
Q1 (January-March): Post-holiday budget recovery period; lower competition, reduced costs, strong performance for fitness, education, and financial services.
Q2 (April-June): Stable performance period; financial year-end B2B activity increases; autumn fashion and home categories strengthen.
Q3 (July-September): Winter sales and spring preparation; strong retail performance; B2B budget cycles renew.
Q4 (October-December): Peak advertising season; costs increase 40-60% due to retail competition; e-commerce dominates spending.
Strategic seasonal allocation adjusts budgets 20-30% based on these patterns. E-commerce brands might allocate 40% of annual budgets to Q4, while B2B services distribute more evenly with slight Q2 and Q3 emphasis.
Event-Based Adjustments
Beyond quarterly patterns, specific events create temporary opportunities or challenges—EOFY sales, Black Friday/Cyber Monday, Valentine's Day, Mother's Day/Father's Day, and Back to School periods all warrant budget adjustments for relevant businesses.
Plan these adjustments months in advance, increasing budgets 2-3 weeks before peak periods to capture early interest while costs remain reasonable.
Minimum Viable Budgets by Platform
Each platform requires minimum spending thresholds for algorithms to optimize effectively and campaigns to generate meaningful results.
Platform Minimum Monthly Budgets:
- Facebook/Instagram: $1,200 minimum; $2,500+ optimal
- LinkedIn: $2,500 minimum; $5,000+ optimal
- TikTok: $1,000 minimum; $2,500+ optimal
- YouTube: $1,500 minimum; $3,000+ optimal
- Twitter/X: $800 minimum; $1,500+ optimal
- Pinterest: $800 minimum; $1,500+ optimal
Below these thresholds, campaigns struggle to generate sufficient data for algorithmic optimization, creative testing, or audience refinement. You're essentially flying blind with insufficient signal.
If your total budget is $2,000 monthly, concentrating on one or two platforms dramatically outperforms spreading across five platforms at $400 each.
Testing Budget Deployment Strategy
Your testing allocation deserves strategic approach, not random experimentation.
Structured Testing Framework
- Platform viability tests (Month 1): Run minimal campaigns across candidate platforms measuring cost efficiency, audience quality, and creative performance
- Audience refinement tests (Month 2-3): Double down on promising platforms testing demographic, interest, and behavioral targeting variations
- Creative format tests (Month 3-4): Experiment with video, carousel, Stories, Reels identifying highest-performing formats
- Scaling validation (Month 4-6): Gradually increase budgets on winning combinations confirming performance sustains at scale
This structured approach generates actionable insights rather than inconclusive data from scattered random tests.
Kill or Scale Decision Criteria
Establish clear criteria determining when tests graduate to core allocation or get terminated:
Graduation criteria:
- Achieves target ROAS or CPA within 30% of benchmark
- Generates meaningful volume (minimum 20 conversions for statistical significance)
- Shows improving trends over testing period
Termination criteria:
- Costs exceed benchmarks by 50%+ with no improvement trajectory
- Insufficient volume after 60 days testing
- Audience quality significantly lower than primary channels
Decisive action prevents indefinite testing of mediocre performers while ensuring winners get scaled appropriately.
Multi-Platform Attribution Challenges
Budget allocation becomes complicated when customers touch multiple platforms before converting. The customer who sees your Instagram ad, later clicks a Facebook ad, then converts through a LinkedIn retargeting campaign—which platform deserves budget credit?
Attribution Model Implications
Last-click attribution: Credits final platform touched; undervalues awareness and consideration platforms; benefits retargeting channels.
First-click attribution: Credits initial discovery platform; undervalues conversion drivers; benefits awareness campaigns.
Linear attribution: Distributes credit equally across all touchpoints; oversimplifies complex journeys.
Data-driven attribution: Uses algorithmic modeling determining each touchpoint's contribution; most accurate but requires sophisticated tracking and significant data volume.
Most Australian SMEs use last-click by default (platform native attribution), creating distorted budget allocation favouring bottom-funnel tactics over awareness building.
Practical Recommendation:
Understand your attribution limitations and balance quantitative performance data with qualitative customer journey understanding. Survey new customers asking how they discovered you. Review assisted conversions in platform analytics. Recognize that awareness platforms (YouTube, upper-funnel Facebook campaigns) create value not fully captured in last-click attribution.
Budget Reallocation Triggers
Static allocation fails as performance shifts. Establish triggers prompting budget reallocation reviews.
Performance Triggers:
- Platform ROAS drops 25%+ for three consecutive weeks
- CPA increases 40%+ beyond acceptable thresholds
- Audience saturation indicators (frequency above 4, declining CTR despite creative refresh)
- Competitor activity significantly increases costs
Opportunity Triggers:
- New platform achieving test success warrants scaled investment
- Seasonal period approaching favouring specific platforms
- Product launch requiring awareness emphasis shifts allocation
- Expanded geographic markets with different platform preferences
External Triggers:
- Platform algorithm changes affecting performance
- Privacy/tracking updates impacting attribution
- Economic conditions changing customer behaviour
- Industry trends shifting platform preferences
Review allocation monthly with quarterly deep dives. Agile reallocation based on performance data maximizes ROI while preventing budget waste on declining channels.
Common Budget Allocation Mistakes
Avoid these frequent errors that undermine advertising effectiveness.
Mistake 1: Vanity Metric Optimization
Optimizing for cheap clicks, impressions, or engagement rather than business outcomes wastes budgets on meaningless activity. A $0.40 click generating zero revenue is worthless compared to a $4.00 click converting at 8%.
Always optimize toward metrics directly tied to business value—purchases, qualified leads, sign-ups, bookings.
Mistake 2: Ignoring Lifetime Value
Allocating budgets based on first-purchase profitability misses massive value for businesses with high customer LTV. A subscription business acquiring $50 customers who generate $1,200 lifetime value should pay dramatically more than businesses with one-time $50 transactions.
Factor LTV into acceptable acquisition costs and platform allocation decisions.
Mistake 3: Premature Platform Abandonment
Declaring platforms unsuccessful after 2-3 weeks or $500 spent prevents proper testing. Most platforms require 30-60 days and 50+ conversions for algorithms to optimize effectively.
Give platforms adequate time and budget before concluding they don't work.
Mistake 4: Over-Diversification
Spreading budgets across 6-7 platforms prevents achieving minimum viable budgets on any single platform. Better to dominate 2-3 platforms than perform poorly across many.
Your Strategic Budget Allocation Roadmap
Building an effective social media advertising budget allocation requires understanding your business objectives, knowing platform costs and capabilities, testing strategically, and remaining agile based on performance data.
The Australian businesses achieving exceptional advertising ROI aren't necessarily those with the largest budgets—they're those allocating their budgets most strategically to platforms, audiences, and creative approaches delivering demonstrated results.
Start with your customer. Where do they spend time? What content formats resonate? Which platforms drive purchase decisions in your category? Build your allocation around customer behaviour, not platform popularity or personal preferences.
Test deliberately. Reallocate boldly. Optimize continuously. Your budget allocation should evolve as you learn, as markets shift, and as platform dynamics change.
Maximize Your Advertising Investment
Effective social media advertising budget allocation determines whether your investment generates exceptional growth or disappointing returns. Strategic platform selection, appropriate budget concentration, and continuous optimization separate successful campaigns from wasted spending.
At Maven Marketing Co, we help Australian businesses develop and execute data-driven social media advertising strategies that maximize ROI through strategic budget allocation across platforms. Our team combines platform expertise with Australian market knowledge to build advertising programmes that efficiently acquire customers and drive sustainable growth.
Ready to stop wasting advertising budget on platforms that don't deliver and start concentrating investment where it generates real returns? Let's discuss how strategic budget allocation can transform your social media advertising performance. Visit mavenmarketingco.com.au to schedule your complimentary advertising strategy consultation and discover how to make every advertising dollar work harder for your business.

Table of contents
read more blogs

Handing the Keys to Google's AI: How to Keep Control of Your Ad Budget Inside Performance Max
Performance Max is Google's most automated campaign type, and also the one that provokes the most anxiety among Australian advertisers who have spent years developing campaign management practices that depend on visibility, control, and the ability to make deliberate, measurable changes. The anxiety has some basis. Performance Max does take more control away from the advertiser than any previous Google Ads campaign type: it chooses the placements, it selects the creative combinations, it determines the bid for each impression, and it distributes the budget across Google's inventory in ways the advertiser cannot directly specify. The part of the anxiety that is not well based is the conclusion that these constraints make Performance Max unmanageable or a blank cheque handed to Google's algorithm. Performance Max has a specific set of levers that, when correctly configured, give advertisers meaningful influence over where the budget goes, which audiences it targets, which creative assets it uses, and which conversion events it optimises toward. Understanding and using these levers is the difference between a Performance Max campaign that works within the advertiser's strategic parameters and one that wastes budget on inventory, audiences, and objectives that the business never intended to pursue.

When Customers Search on TikTok and Instagram Instead of Google — How Australian Brands Adapt
Something structurally significant has changed in how younger Australian consumers research purchases, and most Australian brands have not yet adjusted their discoverability strategy to reflect it. A proportion of the audience that would previously have opened Google to search for "best brunch spots Fitzroy" or "honest review Mecca skincare serum" is now opening TikTok or Instagram instead. They are searching within these platforms for short video content that shows them what they want to know: the actual food, the actual product, the actual experience, from people who have actually been there or used the item. This is not a marginal behaviour limited to a niche demographic. TikTok's own data has reported that a significant share of its users use the platform as a search engine, and the query patterns on Instagram's search function have expanded well beyond celebrity and hashtag discovery into product, venue, and service research. For Australian brands that have built their discoverability strategy entirely on Google organic search and Google Ads, this shift represents a gap that is growing over time as the audience that uses social platforms as primary discovery tools ages into demographics with higher purchasing power. This article covers what the shift to social search means practically, what content and account configuration signals these platforms use to surface results, and what Australian brands need to do differently to be found on TikTok and Instagram by people who are actively looking for what they offer.

How to Build a Google Business Profile That Converts Browsers Into Booked Appointments
A Google Business Profile that has been set up and left alone is doing roughly the same work as a shop front with the lights off. It confirms the business exists and provides the phone number, but it is not actively persuading a local searcher who is comparing three businesses in the search results to choose this one rather than the competitors sitting directly above and below it in the local pack. The businesses that win appointments from Google local search are not simply those that are closest to the searcher or those with the most reviews, although proximity and reviews both matter. They are the businesses that have treated their Google Business Profile as a conversion surface rather than a directory entry, and have populated every element of the profile with the specific information, imagery, and social proof that a local searcher needs to make a confident decision to book rather than keep browsing. The difference between a profile that ranks and converts and one that ranks but loses its potential customers to competitors is in the specific decisions this article covers: how to write the business description, which photos produce engagement, how to use posts to maintain freshness signals, how to respond to reviews in a way that builds rather than diminishes trust, and how to configure the booking and contact features that reduce friction between intent and appointment.


