.svg)
.svg)
.svg)


%201.svg)

Quick Answer: How Does Data Visualization Drive Engagement and Conversions?
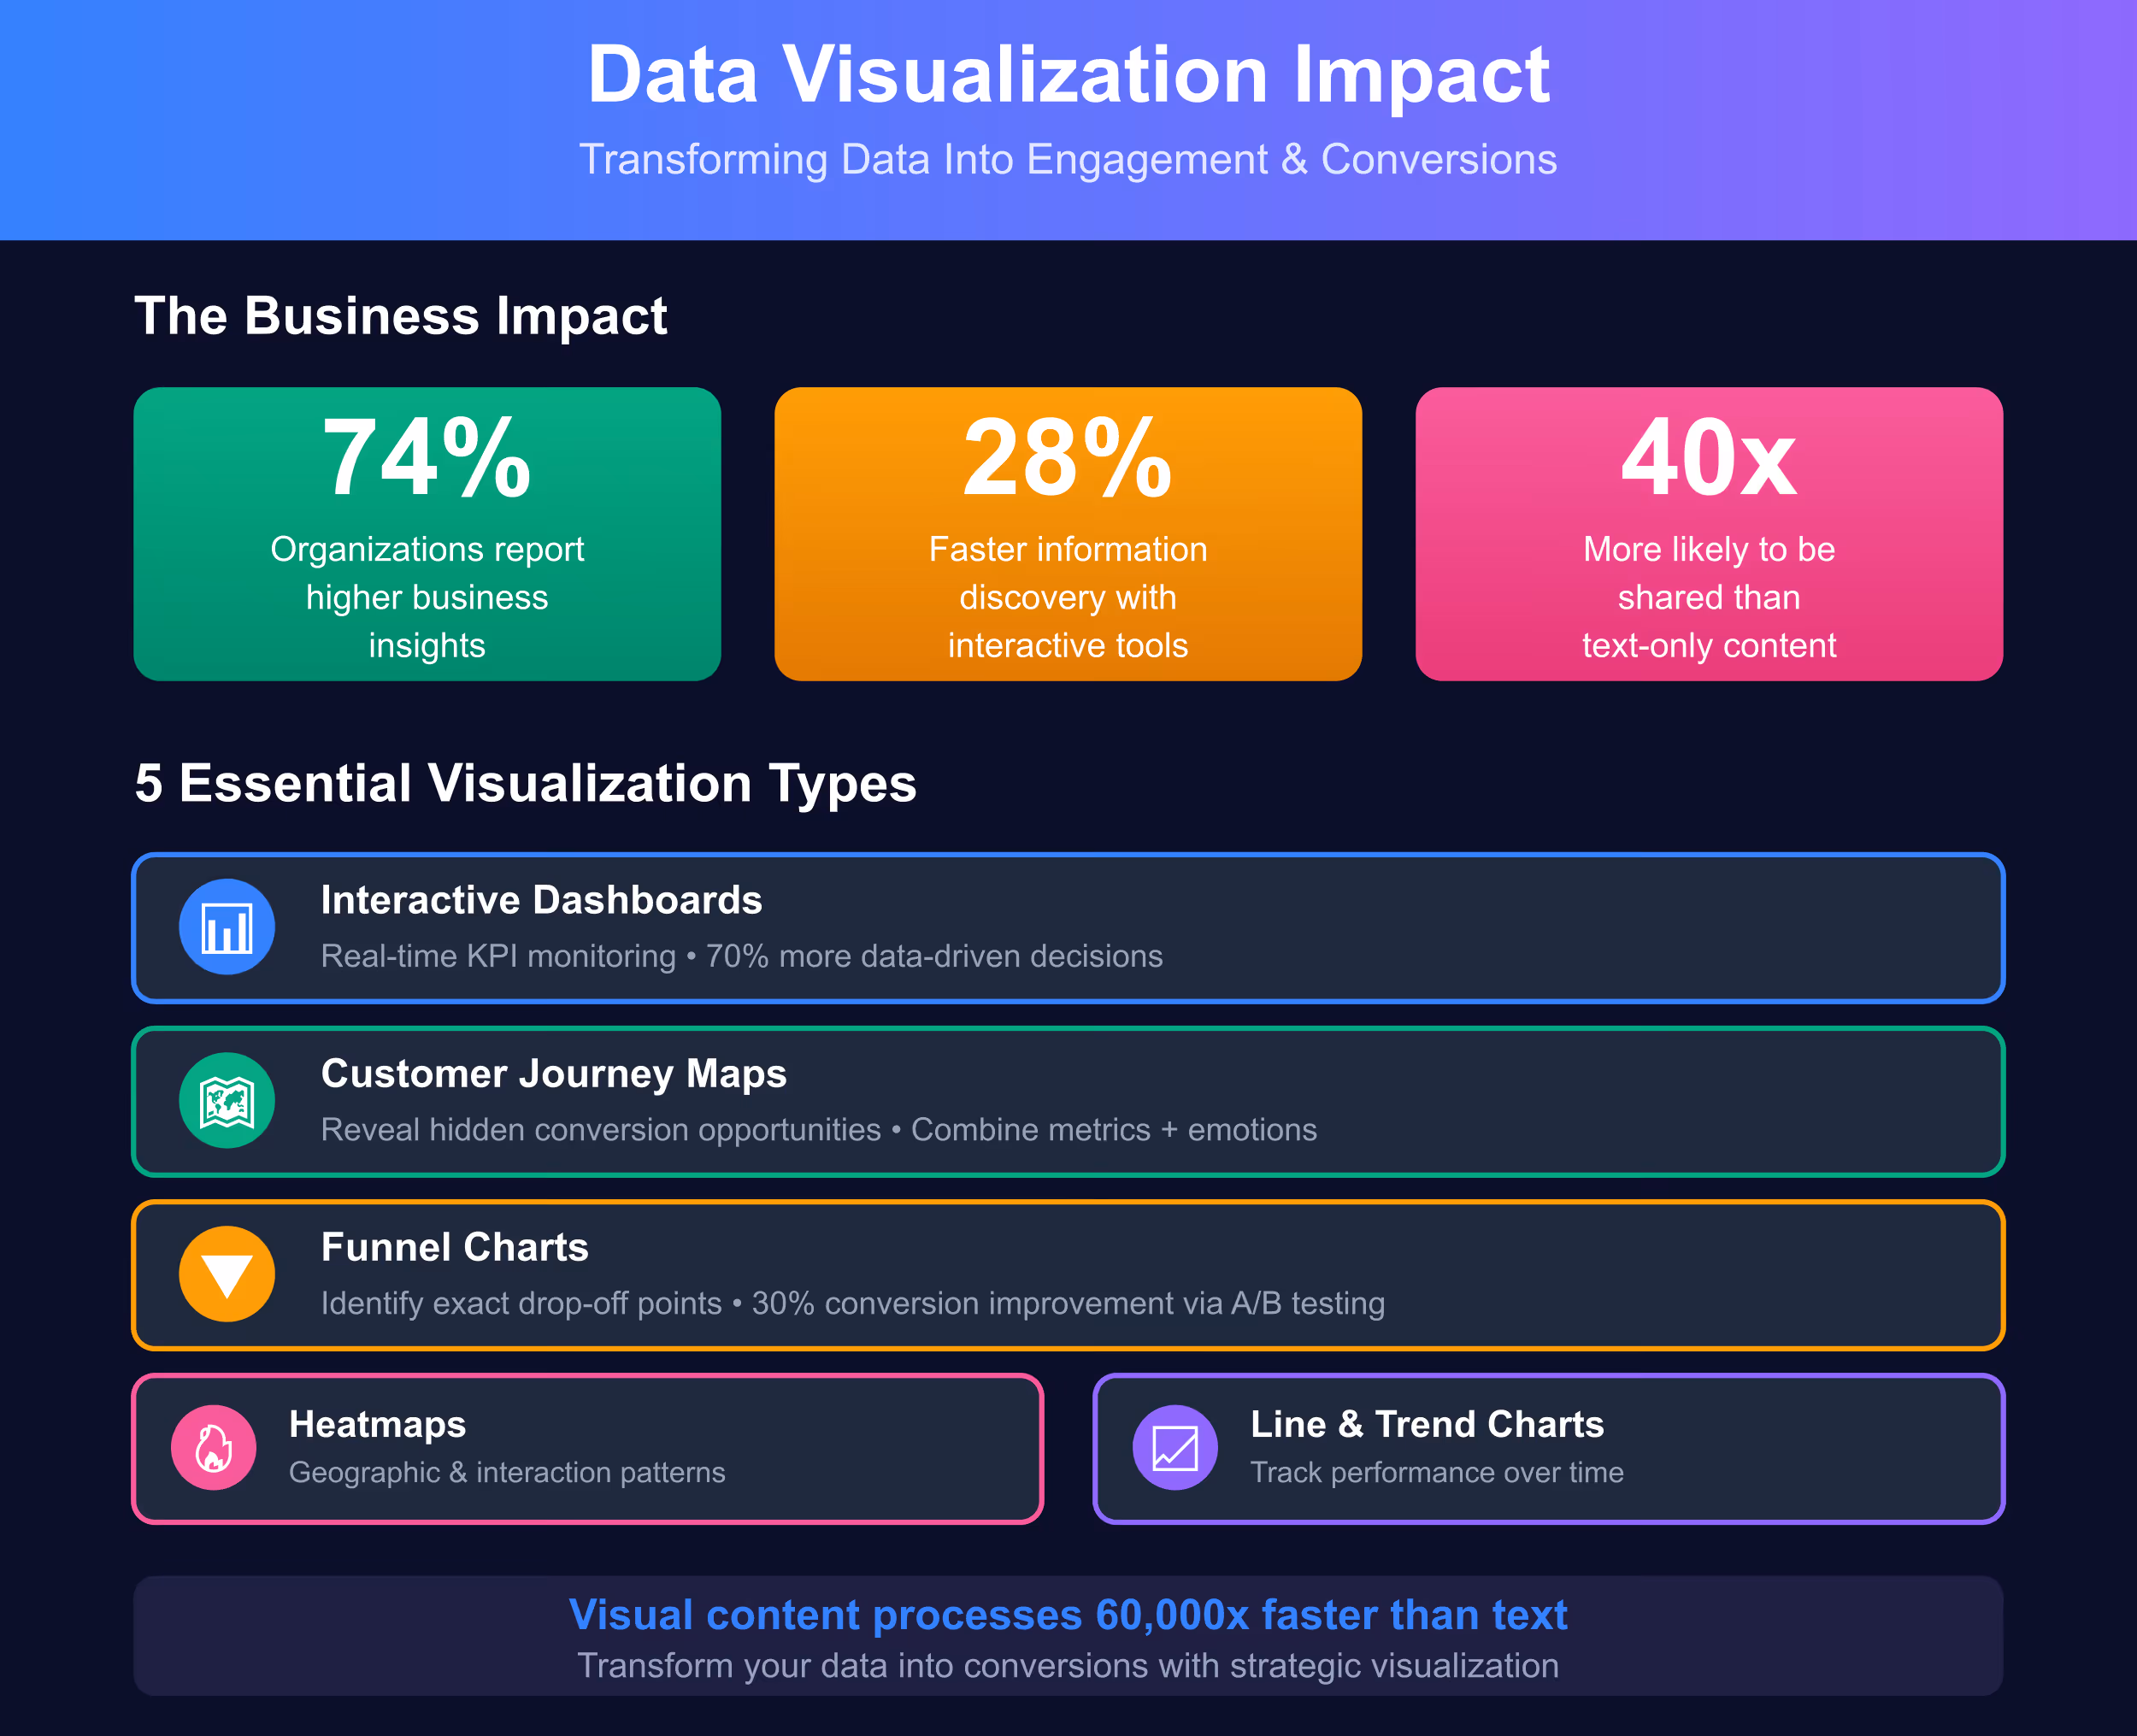
Data visualization transforms complex datasets into visual formats that audiences can instantly comprehend, leading to faster decision-making, improved engagement, and higher conversions. Companies using advanced visualization platforms report an average 20% increase in business growth, with adoption growing by approximately 65%. The impact is measurable: businesses using interactive visualization tools are 28% more likely to find information quicker than those relying on static dashboards, organizations using these tools are 70% more likely to make data-driven decisions, and visual content is 40 times more likely to get shared online than text-only content. For conversions specifically, effective visualizations identify drop-off points in customer journeys, with A/B testing visualizations improving conversion rates by 30% on average. Key techniques include interactive dashboards providing real-time KPI monitoring, customer journey visualizations revealing hidden conversion opportunities by combining quantitative metrics with emotional touchpoint analysis, funnel charts highlighting exactly where users abandon the purchase process, and animated data storytelling that makes insights engaging and memorable. Australian businesses benefit particularly from geographic heatmaps showing regional performance variations, social media engagement visualizations tracking platform-specific metrics, and mobile-optimized dashboards accommodating the 57.8% of users accessing internet primarily through smartphones. The secret isn't just presenting data—it's crafting visual narratives that contextualize information, emphasize trends, inspire action, and ultimately convert viewers into customers through clear, compelling communication that respects attention spans whilst delivering actionable insights.
Key Takeaways: Data Visualization for Australian Business Results
Why Visualization Matters for Engagement and Conversions:Research demonstrates that 65% of people learn better through visual presentation than written information, making visualization essential for communicating key details. In 2024, the role of data visualization in turning raw data into actionable insights and shaping business strategies continues to be crucial, ensuring data is accurately represented and delivers actionable insights in clear, engaging manners. Interactive reports engage users by letting them delve deeper independently without consulting developers, encouraging more profound personal interaction with data fostering greater insight and understanding. For conversions specifically, visualizations help identify friction points—the Baymard Institute found 69.57% of online shopping carts are abandoned, often due to complex checkout processes that visualization techniques can identify and fix. Retargeted ads informed by visualization data boost conversions by over 150%, whilst customer segmentation visualizations that group users by demographics, behaviour or preferences enable tailored marketing strategies that significantly improve conversion rates.

Essential Visualization Types for Marketing Success:
- Funnel Charts: Show how leads move from impression to click to conversion, highlighting exact drop-off points for optimization
- Line Graphs: Track changes over time for daily traffic, monthly revenue or campaign performance, ideal for spotting trends and seasonal patterns
- Heatmaps: Use colour gradients showing patterns across large datasets, particularly powerful for geographic performance and website interaction analysis
- Customer Journey Maps: Combine quantitative metrics like conversion rates with qualitative insights such as emotional states at critical touchpoints, revealing hidden conversion opportunities competitors overlook
- Real-Time Dashboards: Provide up-to-the-minute insights enabling businesses to respond immediately to customer preferences and market developments, giving competitive advantage by seizing opportunities and avoiding mistakes
Platform and Tool Selection for Australian Businesses: For Australian marketing teams, tool selection depends on specific needs: Google Looker Studio for those already in Google ecosystem offers free access with excellent integration; Power BI bridges marketing and finance beautifully for Microsoft users tracking ROI tied to business KPIs; Tableau holds dominance for sophisticated data analysts with advanced capabilities; Databox gets dashboards running fast with slick mobile experience perfect for agencies and smaller teams; specialised Australian solutions like Octobits (built by Nexalab) address local marketing realities with flexible licensing and dashboards connecting marketing and operations contextually. Key evaluation criteria include ease of use for non-technical team members, integration with existing platforms (Google Analytics, social media, CRM systems), mobile optimization given Australian smartphone adoption rates, and whether pricing structures suit SME budgets versus enterprise investments.
Data Storytelling Framework That Converts: Effective visualization transcends mere number presentation—it knits narratives engaging and captivating audiences. This involves contextualizing data, emphasizing trends, and offering insights. The framework includes: (1) Define clear narrative arc with beginning (problem/question), middle (data exploration), and end (actionable insight); (2) Use progressive disclosure revealing information gradually to maintain engagement and prevent overwhelming viewers; (3) Combine multiple visualization types creating richer stories than single chart types allow; (4) Add human context through case studies, testimonials or customer quotes making data relatable; (5) Design for mobile-first experiences since 57.8% of global internet traffic comes from mobile devices, requiring responsive layouts and touch-optimized interactions. Australian businesses should particularly emphasize localization in storytelling—reference local market conditions, compare against Australian benchmarks, and use culturally relevant examples ensuring visualizations resonate authentically with domestic audiences whilst maintaining international appeal where necessary.
The Engagement Crisis: Why Traditional Reporting Fails
Australian businesses drown in data whilst starving for insights. Marketing teams collect thousands of data points across Google Analytics, social media platforms, email campaigns, CRM systems, and e-commerce platforms, yet struggle to extract actionable intelligence driving business decisions. The problem isn't data availability—it's data comprehension.
Traditional reporting methods exacerbate rather than solve this challenge. Spreadsheets containing hundreds of rows and dozens of columns present information technically but fail to communicate meaning. Static PDF reports delivered weekly or monthly become outdated before stakeholders finish reviewing them. Dashboard tools requiring technical expertise to navigate remain inaccessible to decision-makers needing quick insights without consulting data specialists.
The human brain processes visual information 60,000 times faster than text. We're pattern-recognition machines evolved to extract meaning from visual stimuli rapidly. Yet most business reporting persists in presenting data as tables, numbers, and text descriptions that require conscious effort to interpret. This mismatch between how humans naturally process information and how businesses traditionally present it creates the engagement crisis undermining data-driven decision-making.
More than half (53%) of business leaders and data professionals agree that dashboards are not an effective way to present data due to the time it takes to interpret them. This startling statistic reveals that even dedicated dashboard tools often miss the mark, presenting information that requires excessive cognitive load to extract actionable insights. The solution isn't abandoning data presentation—it's transforming how we visualize it.
For Australian businesses competing in increasingly data-driven markets, this engagement crisis carries real consequences. Competitors leveraging effective visualization techniques make faster decisions, identify opportunities earlier, respond to market changes more nimbly, and execute campaigns more efficiently. Meanwhile, businesses stuck in traditional reporting cycles analyze yesterday's data to make tomorrow's decisions, perpetually lagging market dynamics.
The conversion implications are equally significant. When marketing teams can't quickly identify which campaigns drive results, which audience segments convert best, or where friction points derail customer journeys, they waste budget on ineffective tactics whilst missing optimization opportunities. Effective data visualization doesn't just make information prettier—it makes businesses smarter, faster, and more profitable.

Understanding Engagement Through Visualization: The Psychology
Before exploring specific techniques, understanding why visualization drives engagement requires examining cognitive psychology underlying visual information processing. This foundation explains which visualization choices work and why others fail despite technical accuracy.
The Picture Superiority Effect
Research demonstrates that people remember visual information significantly better than verbal information. Present someone with purely textual information, and they'll recall approximately 10% three days later. Add relevant imagery, and recall jumps to 65%. This picture superiority effect explains why infographics, charts, and visual dashboards generate higher engagement than text reports containing identical information.
For Australian digital marketing campaigns, this principle transforms content strategy. Product descriptions accompanied by data visualizations showing performance metrics, comparison charts, or usage statistics generate higher engagement than text-only descriptions. Marketing reports presented as visual stories retain attention better than spreadsheet exports, ensuring stakeholders actually review insights rather than filing reports unread.
Cognitive Load and Information Architecture
Effective visualization reduces cognitive load—the mental effort required to process information. Poor visualization increases it, forcing viewers to work harder extracting meaning. The difference determines whether audiences engage with data or abandon it for easier-to-process alternatives.
Consider two ways of presenting conversion funnel data: a dense paragraph describing that 10,000 people saw an ad, 1,200 clicked through, 450 visited product pages, 180 added items to cart, and 72 completed purchases; versus a visual funnel chart showing these stages with proportional sizing and percentage labels. The visual version communicates identical information whilst requiring fraction of cognitive effort. Viewers instantly grasp conversion rate (0.72%), identify largest drop-off point (click to product page visit), and comprehend funnel health without conscious calculation.
Australian businesses serving time-constrained decision-makers must prioritize cognitive load reduction. Executives reviewing multiple reports daily won't engage deeply with visualizations requiring effort to interpret. However, they'll readily consume and act upon insights presented with minimal cognitive friction.
The Storytelling Imperative
Humans are storytelling creatures. We remember narratives far better than isolated facts. Effective data visualization harnesses storytelling psychology, presenting data as narrative arcs with beginnings, middles, and ends rather than disconnected charts floating without context.
Effective data storytelling transcends mere numbers—it's knitting narratives that engage and captivate audiences. This involves contextualizing data, emphasizing trends, and offering insights. Where attention spans are fleeting, storytelling not only informs but inspires action. Mastery of data storytelling becomes pivotal whether you're data analyst, marketer, or executive.
For Australian marketing teams, storytelling transforms campaign performance reports from mere metrics recitation into compelling narratives about customer behaviour, market opportunities, and strategic insights. Rather than presenting "email open rates increased 15%," storytelling visualizations show the journey: identifying audience segments responding to specific messaging, testing variations, implementing winners, and achieving measurable improvement—complete with visual progression showing the story unfold.
Essential Visualization Types for Marketing Engagement
Different data types and communication objectives require different visualization approaches. Mastering the appropriate chart type for specific purposes separates effective visualization from confusing clutter. The following essential types address common Australian marketing scenarios.
Interactive Dashboards: Real-Time Intelligence
Dynamic dashboards are quickly replacing traditional static reports, offering up-to-the-minute data visualization insights vital in today's fast-paced world. Financial institutions use dashboards updated in real time to track stock prices, evaluate market patterns, and decide on best trades. Marketing teams leverage similar capabilities monitoring campaign performance, website traffic, social media engagement, and conversion metrics continuously rather than waiting for weekly reports.
Effective dashboards prioritize hierarchy, placing most critical KPIs prominently whilst secondary metrics remain accessible without cluttering primary view. Australian marketing tool Octobits emphasises contextual dashboards connecting marketing and operations, recognising that isolated metrics mean little without business context surrounding them.
Design principles for engagement-driving dashboards include clear visual hierarchy with largest elements representing most important metrics, colour-coding using consistent schemes where green indicates positive performance and red flags concerns, interactive filtering enabling users to drill down into specific campaigns, date ranges, or segments, and mobile optimization ensuring executives can review performance from smartphones during commutes or between meetings.
Australian businesses should customize dashboards for specific stakeholder needs rather than creating one-size-fits-all views. CMOs require high-level strategic overview. Social media managers need platform-specific engagement metrics. PPC specialists want detailed cost-per-conversion data. Tailored dashboards ensure each stakeholder engages with information relevant to their responsibilities.
Customer Journey Visualization: Conversion Mapping
Customer journey visualizations are essential for marketing success, revealing hidden conversion opportunities through frameworks combining quantitative metrics with qualitative insights. Effective journey maps go beyond simple touchpoint analysis, delving into the emotional landscape of customer experience, visualizing emotional states at critical touchpoints, identifying conversion barriers, and uncovering journey gaps competitors may have overlooked.
Construction methodology involves mapping all customer touchpoints across awareness, consideration, purchase, and retention phases; collecting quantitative data including conversion rates, time spent at each stage, and drop-off percentages; gathering qualitative insights through customer feedback, surveys, and support interactions; visualizing emotional states using colour gradients or icons representing satisfaction, confusion, frustration, or delight; and identifying friction points where negative emotions correlate with high abandonment rates.
For Australian e-commerce businesses, journey visualization might reveal that customers feel confident through product browsing but experience significant frustration during checkout—indicated by high cart abandonment combined with negative feedback mentioning confusing shipping options. This insight directs optimization efforts specifically at checkout experience rather than broadly "improving conversions."
The visualization format matters significantly. Linear diagrams work for straightforward journeys but fail to capture complexity when customers move non-linearly between touchpoints. Circular diagrams represent ongoing customer relationships better than linear progressions implying journeys end at purchase. Swimlane formats show how different customer segments experience distinct journeys despite interacting with same brand.

Funnel Charts: Conversion Bottleneck Identification
Funnel visualization shows how leads or customers move from one step to another—from ad impression to click, to form fill, to conversion. They highlight where users drop off, helping marketers identify and fix friction points in the journey. Funnels may be horizontal, vertical, or integrated with tabular data showing exact numbers alongside visual proportions.
Effective funnel charts make drop-off points immediately obvious through proportional sizing. If 10,000 people see an ad, 1,200 click through, but only 450 visit product pages, the massive size difference between click and visit stages visually screams "this is your problem area" without requiring calculation. Colour coding can emphasize this further—green for healthy conversion rates, yellow for concerning drops, red for critical bottlenecks.
Australian marketing teams should visualize multiple funnels simultaneously for comparison. How does mobile funnel compare to desktop? How do different traffic sources convert? Which product categories show strongest progression? Comparative funnel visualization reveals patterns individual funnels obscure, enabling strategic resource allocation toward highest-performing channels.
Advanced funnel visualization incorporates time dimension, showing how funnel performance changes across days, weeks, or months. Seasonal patterns, campaign impacts, and gradual degradation or improvement become visible, informing both tactical optimizations and strategic planning.
Heatmaps: Pattern Recognition at Scale
Heatmaps show data using colour gradients and matrix format, revealing patterns and correlations across large datasets. Marketing applications include website interaction heatmaps showing where users click, scroll, and focus attention; geographic heatmaps displaying regional performance variations; time-based heatmaps identifying optimal posting times for social media; and correlation heatmaps revealing relationships between variables that inform targeting strategies.
Geographic heatmaps prove particularly valuable for Australian businesses serving diverse regions. Visualization might reveal that Sydney and Melbourne drive 70% of conversions despite representing only 40% of website traffic—insight directing paid advertising budget toward these high-converting markets. Alternatively, heatmaps might identify underperforming regions where brand awareness campaigns could unlock latent demand.
Time-based heatmaps analyzing social media engagement across days and hours identify precise windows when audiences are most receptive. According to Geomobile, 68% of consumers are more likely to engage with brands thanking them for visiting particular locations—geographic insights enabling hyper-targeted engagement strategies.
Website interaction heatmaps using tools like Hotjar or Crazy Egg show exactly where visitors click, how far they scroll, and which elements capture attention. This visualization reveals whether critical CTAs receive attention or go unnoticed, whether users find navigation intuitive or confusing, and which content engages versus which gets ignored—all without asking users to articulate behaviour they may not consciously recognize.
Line and Trend Visualization: Temporal Pattern Recognition
Line charts help track changes over time such as daily traffic, monthly revenue, or campaign performance, especially useful for spotting trends and seasonal patterns. Comparing multiple data points like different channels or audience groups provides clear side-by-side views revealing relationships and divergences.
Effective temporal visualization requires appropriate time granularity. Daily data suits short-term campaign monitoring. Weekly aggregation smooths daily volatility revealing clearer patterns. Monthly trends show seasonal cycles. Yearly comparisons highlight long-term growth trajectories. Choosing wrong granularity either obscures meaningful patterns through excessive noise or misses important short-term changes through excessive aggregation.
Australian businesses should overlay comparative periods enabling pattern recognition. Comparing current year performance against prior year identifies growth or decline. Comparing current campaign against previous similar campaigns reveals whether performance improvements reflect campaign quality or seasonal trends. Comparing actual performance against targets or forecasts shows whether strategies deliver expected results.
Advanced trend visualization incorporates predictive elements using statistical techniques to project future performance based on historical patterns. These forecasts, displayed with confidence intervals showing uncertainty ranges, help Australian marketing teams plan budgets, set realistic targets, and identify early whether current trajectories will achieve objectives or require course correction.
Data Storytelling: From Charts to Narrative
Creating individual visualizations represents only first step. Transforming those visualizations into compelling narratives that drive engagement and conversions requires deliberate storytelling framework connecting charts to meaningful business insights.
The Three-Act Structure for Data Stories
Adapt classical storytelling structure to data presentations:
Act One—Setup: Establish context and question. What business challenge are we addressing? What prompted this analysis? What question needs answering? Australian marketing teams might establish: "Our overall conversion rate is 2.3%, but we suspect significant variation across customer segments. Understanding which segments convert best will enable more effective targeting and budget allocation."
Act Two—Exploration: Present data progressively revealing insights. Show overall conversion rate, then break down by segment, then compare segment characteristics, then analyze which attributes correlate with higher conversion. Each visualization builds on previous, gradually narrowing toward actionable insight. This progressive disclosure maintains engagement whilst preventing information overwhelm.
Act Three—Resolution: Deliver clear, actionable recommendation supported by data. "High-income professionals aged 35-50 convert at 4.8%—more than double our average. Shifting 30% of acquisition budget toward this segment projects 18% revenue increase with identical spend." Visualization shows projected outcome, making recommendation concrete and measurable.
This structure transforms data presentation from "here are some charts" to "here's a story with beginning, middle, and end" that audiences can follow, remember, and act upon.

Progressive Disclosure and Interactive Narrative
Modern visualization tools enable scrollytelling—narrative experiences where scrolling reveals data progressively, creating immersive storytelling impossible with static formats. Each scroll position reveals next piece of story, maintaining engagement through controlled information flow.
Interactive narrative lets audiences explore data themselves whilst providing guided pathway ensuring key insights aren't missed. Implementation might present high-level summary initially, then enable drilling down into specific segments, time periods, or metrics for audiences wanting deeper understanding. This approach serves both time-constrained executives wanting quick insights and detail-oriented analysts requiring comprehensive exploration.
Australian businesses using tools like Flourish, Tableau, or custom D3.js implementations can create these interactive narratives embedding them into websites, annual reports, or client presentations. Retail Week integrated Flourish visuals with Shorthand reporting: "This was our top-performing commercial sponsored campaign that year. Without being able to integrate Shorthand and Flourish, we just wouldn't have been able to make something as engaging as that."
Annotation and Context: Making Data Meaningful
Raw charts without annotation leave interpretation to viewers who may miss crucial insights or draw incorrect conclusions. Effective visualization includes annotations highlighting significant points, providing context for unusual patterns, explaining external factors influencing data, and directing attention toward actionable insights.
Consider line chart showing website traffic over six months with noticeable spike in April. Without annotation, viewers wonder what caused the spike and whether it's sustainable. With annotation—"Campaign X launched April 15th driving 40% traffic increase; conversion rate remained steady indicating quality traffic"—the chart tells complete story enabling informed decisions about sustaining or scaling the campaign.
Australian businesses should contextualize data against relevant benchmarks. Stating "our email open rate is 22%" means little without context. Adding "22% versus 19% industry average and 20% our historical baseline" immediately communicates that performance exceeds expectations. Visual comparison against benchmarks—perhaps showing your metric as bar against shaded region representing typical range—makes this context immediately comprehensible.
Cultural context matters for Australian audiences. References to local events, market conditions, competitive landscape, or regulatory changes help stakeholders understand why data patterns occur and whether they'll persist. International benchmarks should be noted as such, with commentary about how Australian market differs from global patterns when relevant.
Technical Implementation: Building Engagement-Optimized Visualizations
Understanding which visualizations types to use matters less than implementing them effectively. Technical execution determines whether theoretically appropriate visualizations actually drive engagement or fail despite correct chart selection.
Mobile-First Design Principles
With 57.8% of global internet traffic coming from mobile devices and nearly three-quarters of the world using just smartphones to access internet by 2025, mobile optimization isn't optional—it's fundamental. Yet many visualization tools default to desktop layouts that become illegible or unusable on smartphones.
Mobile-first principles include vertical orientation favouring portrait smartphone screens over landscape desktop monitors, larger touch targets ensuring interactive elements work with finger taps not precise mouse clicks, simplified charts removing detail that clutters small screens whilst preserving core insights, progressive loading showing critical information first with optional detail expansion for users wanting deeper analysis, and responsive typography automatically adjusting font sizes maintaining readability across screen sizes.
Australian marketing teams should test all visualizations on actual smartphones—not just browser developer tools simulating mobile but actual devices with varying screen sizes, resolution densities, and operating systems. What appears functional in desktop simulation often fails in real-world mobile usage where sunlight affects visibility, touch precision differs, and connectivity varies.
Consider that many stakeholders review dashboards during commutes, between meetings, or while travelling. If visualization requires WiFi for acceptable loading speed, desktop-sized screen for readability, or precise mouse control for interaction, it fails mobile use cases representing significant portion of actual usage.
Colour Psychology and Accessibility

Colour choices dramatically affect both aesthetic appeal and functional accessibility. Effective colour usage requires understanding psychology, ensuring accessibility, and maintaining consistency.
Psychological principles suggest green connotes success, growth, positive performance; red signals danger, decline, attention needed; blue conveys trustworthiness, stability, professionalism; orange indicates warning, caution, moderate concern; and neutral grey works for baseline or comparative information. Australian audiences generally share these associations, though cultural sensitivity matters for brands serving multicultural communities where colour symbolism varies.
Accessibility requirements demand colour choices work for colour-blind users comprising approximately 8% of males and 0.5% of females. Never rely solely on colour to communicate information—combine colour with patterns, labels, or icons ensuring information remains comprehensible even without colour perception. Test visualizations using colour-blindness simulators ensuring critical distinctions remain visible.
Contrast ratios must meet WCAG 2.2 standards—at minimum 4.5:1 for normal text and 3:1 for large text or graphical elements. Poor contrast renders visualizations illegible particularly on mobile screens viewed in bright sunlight. Many beautiful visualizations fail accessibility testing because designers prioritized aesthetics over function.
Consistency across visualizations establishes visual language audiences quickly internalize. If green means "good" in one chart, it must mean "good" in all charts. Inconsistent colour usage confuses audiences and undermines trust in data presentation.
Animation and Interaction: Engagement Without Gimmickry
Interactive and animated data visualizations have exploded in popularity on social media, with videos showcasing evolving datasets often going viral, significantly boosting brand visibility. The core appeal is simple: interactive charts, animated data, and infographics deliver high-value information rapidly with minimal text—powerful strategy attracting attention and driving engagement because users get informed quickly without extensive reading, effectively stopping endless scrolling.
However, animation must serve purpose beyond mere visual interest. Effective animation includes transition between states showing how data changes rather than just presenting before/after snapshots, progressive reveal building narrative by introducing elements sequentially, highlighting changes using motion to draw attention to significant shifts or anomalies, and demonstrating relationships through animated connections showing how variables influence each other.
Gratuitous animation distracts from insights, increases cognitive load, and annoys audiences. Every animated element should answer "why is this animated?" with clear functional justification beyond "because we can."
Interaction enables personalization letting audiences explore aspects most relevant to their interests and responsibilities. A social media platform's head of marketing looks at different KPIs than social media manager, with context-aware visualization showing metrics relevant to specific users. Interaction accommodates these varying needs without creating separate dashboards for every stakeholder.
Australian businesses should implement interaction thoughtfully. Common approaches include filtering by date range, segment, campaign, or geographic region; drilling down from summary to detailed views; comparing different time periods, segments, or scenarios; and tooltips providing additional context on hover or tap without cluttering primary visualization.
Conversion Optimization Through Visualization: Practical Applications
Understanding visualization principles and techniques means little without applying them to drive measurable business outcomes. The following practical applications demonstrate how Australian businesses leverage visualization for conversion optimization.

A/B Test Results Visualization
Research by Optimizely reveals businesses using A/B testing see conversion rate improvement of 30% on average. However, test results presented as statistical tables rarely drive action. Visualization transforms test outcomes into compelling narratives prompting immediate implementation of winners.
Effective A/B test visualization shows both variants side-by-side for direct comparison, indicates statistical significance visually through confidence intervals or clear labelling, projects impact of implementing winner across full traffic, calculates expected revenue or conversion lift, and provides sufficient context for stakeholders to approve implementation confidently.
Australian marketing teams running multiple tests simultaneously benefit from meta-visualization showing portfolio of tests, their status, expected impact, and priority for implementation. This portfolio view prevents valuable winning variations from languishing unimplemented whilst resources get diverted to lower-impact activities.
Customer Segment Performance Analysis
Studies indicate 70% of company revenue comes from 30% of loyal customers. Identifying which customer segments contribute disproportionate value enables strategic resource allocation maximizing ROI. Visualization makes segment analysis actionable by showing performance metrics, lifetime value, acquisition costs, and profitability for each segment side-by-side, revealing which segments deserve increased investment and which may not justify acquisition costs.
Visualization might reveal that whilst low-income young adults represent largest segment by volume, high-income professionals generate 3x lifetime value despite comprising only 15% of customer base. This insight redirects acquisition spending toward more profitable segments even if it reduces total customer volume.
Australian businesses should segment by dimensions relevant to their business model: demographics, geographic location, acquisition channel, product category preference, purchase frequency, or engagement level. Multi-dimensional visualization—perhaps using bubble charts where size represents revenue, colour indicates profitability, and position shows acquisition cost versus retention rate—reveals complex patterns simple tables obscure.
Social Media Engagement Optimization
According to Sprout Social, 64% of consumers expect brands to interact on social media. Meeting these expectations requires understanding which content drives engagement and when audiences are most receptive. Visualization transforms social analytics from vanity metrics into actionable intelligence.
Effective social media visualization includes engagement rate trends showing how interaction evolves over time, content type performance comparing images versus videos versus text, posting time analysis identifying optimal publication windows, hashtag performance revealing which tags expand reach versus which add little value, and competitor comparison showing your performance relative to market.
Australian businesses managing multiple social platforms benefit from unified visualization consolidating Facebook, Instagram, LinkedIn, TikTok, and Twitter metrics into single view. Marketing data visualization tools help teams spot campaign issues before they burn through budget and catch golden opportunities in customer behaviour.
Geographic Performance Mapping
Localized content marketing can lead to higher click-through rates by 80% when aligned with regional interests. Australian businesses serving geographically diverse markets—whether across states, between metropolitan and regional areas, or internationally—need geographic visualization revealing performance variations.
Choropleth maps using colour intensity to represent metric values provide instant geographic insight. Dark regions indicate strong performance whilst light regions flag opportunities or concerns. Interactive implementation enables drilling down from national to state to city level, revealing patterns at appropriate granularity for decision-making.
Geographic visualization might reveal unexpected patterns: Perth outperforming despite smaller population, regional Queensland showing surprisingly strong engagement, or Hobart presenting untapped opportunity based on low competition. These insights inform localization strategies, regional campaigns, and distribution decisions impossible to identify from aggregate national metrics.
Measuring Visualization Effectiveness: Analytics on Analytics
Creating beautiful visualizations means little if they don't actually drive engagement and conversions. Meta-analysis measuring how stakeholders interact with visualizations themselves reveals what works and what needs improvement.
Engagement Metrics for Dashboards
Track how stakeholders actually use visualization tools: frequency of access (daily, weekly, monthly, or never?), time spent per session, which visualizations receive most attention, which interactive features get utilized, and whether users drill down into details or stay at summary level. Low engagement indicates visualization fails to provide value stakeholders need or presents information in ways requiring excessive effort to extract insights.
Organizations using KPIs effectively can improve ROI by up to 50% within a year. However, if stakeholders don't engage with dashboards presenting those KPIs, potential value remains unrealized. Measuring engagement reveals whether visualization facilitates or hinders data-driven decision-making.
Australian marketing teams should conduct user testing with actual stakeholders. Watch them interact with dashboards noting where they struggle, what questions visualization fails to answer, and what additional context would make insights actionable. These qualitative insights complement quantitative engagement metrics revealing not just what happens but why.
Conversion Impact Attribution
Ultimately, visualization's value lies in driving better decisions that improve business outcomes. Attribution analysis connects visualization usage to conversion improvements: do teams using specific dashboards achieve better campaign performance? Do visualizations highlighting particular insights correlate with implementing optimization driving measurable results? Does visualization enable faster identification of winning strategies?
A/B testing applies to visualization itself. Present one group with traditional reporting and another with enhanced visualization. Measure whether visualization group makes faster decisions, implements more optimizations, or achieves better campaign performance. This rigorous testing validates visualization investment and identifies which approaches deliver greatest impact.
Australian businesses should establish clear hypotheses about how visualization will improve performance—"Geographic heatmaps will enable regional targeting improving conversion rates by 15%"—then measure whether these hypotheses prove accurate. Validated hypotheses justify further visualization investment; disproven hypotheses redirect effort toward more impactful approaches.
Future-Proofing: Emerging Visualization Trends
The visualization landscape evolves continuously as technology advances and audience expectations shift. Australian businesses should monitor emerging trends deciding which to adopt, experiment with, or observe from distance.

AI-Powered Automated Insights
AI algorithms can sift through vast datasets swiftly, uncovering hidden patterns and trends that might elude human analysts. Furthermore, AI-driven data visualizations can adapt in real time, ensuring insights they convey are always current, allowing organizations to make data-driven decisions faster and more accurately.
Generative AI tools automatically create narratives contextualizing data trends, making insights more engaging. A generative AI system might analyze sales data, identify surge in demand for specific product, and produce detailed report paired with visually compelling charts and graphs—all in minutes.
Australian businesses should evaluate AI visualization tools based on whether they actually save time versus adding complexity, whether automated insights prove accurate and actionable versus generating noise, and whether AI augments human judgment versus replacing strategic thinking. AI excels at pattern recognition and routine analysis but struggles with nuanced interpretation requiring business context and strategic vision.
Augmented and Virtual Reality Visualization
AR and VR can break down barriers to data comprehension, transforming complex datasets into immersive 3D visualizations users can explore intuitively, enhancing comprehension whilst making data more engaging and memorable. Urban planners visualize city infrastructural data in 3D, overlaying it on real-world landscapes to foresee potential challenges or advantages.
For Australian marketing teams, AR might enable visualizing customer journey data in physical retail spaces, overlaying heatmaps showing where customers pause, browse, or abandon carts directly onto store layouts. VR could create immersive data environments where marketers "walk through" campaign performance data, examining metrics from multiple angles and discovering relationships invisible in two-dimensional representations.
However, AR/VR visualization remains nascent with limited practical applications beyond proof-of-concept demonstrations. Australian businesses should monitor developments whilst focusing resources on proven visualization techniques delivering measurable value today. As hardware becomes ubiquitous and use cases mature, AR/VR may transition from novelty to necessity.
Natural Language Querying
Natural language processing allows users to interact with data using everyday language rather than learning specialized query languages or navigating complex interfaces. Instead of constructing database queries, users simply ask "Which campaigns drove highest ROI last quarter?" and visualization tools automatically generate appropriate charts answering the question.
This democratization enables non-technical stakeholders to explore data independently without consulting analysts for every question. Australian SMEs lacking dedicated data teams benefit particularly from natural language interfaces reducing barriers to data-driven decision-making.
Leading platforms like Tableau, Power BI, and Google Looker Studio incorporate natural language features with varying sophistication. Effectiveness depends on whether the system understands business terminology, whether it generates meaningful visualizations versus technically accurate but unhelpful responses, and whether it handles follow-up questions building on previous context.
Real-Time Collaborative Visualization
As remote work becomes standard, collaborative visualization tools enabling multiple stakeholders to view, annotate, and discuss data simultaneously from different locations become essential. These platforms combine visualization with communication, allowing teams to make collective decisions based on shared data understanding.
Australian businesses with distributed teams across multiple cities, remote workers, or international operations benefit from collaborative visualization reducing meeting time whilst improving decision quality. Rather than lengthy presentations explaining data, teams explore visualizations together, ask questions, test hypotheses, and reach consensus more efficiently.
Platforms like Figma for design, Miro for collaborative brainstorming, and specialized tools like Mode or Hex for data analysis exemplify collaborative visualization approaches. Key features include real-time updates showing changes as they occur, annotation tools letting participants highlight insights or questions, version control tracking analysis evolution, and integration with communication platforms like Slack or Microsoft Teams.
Implementation Roadmap: Getting Started with Conversion-Driving Visualization
Australian businesses ready to leverage visualization for engagement and conversions should approach implementation systematically, starting with foundation and building sophistication gradually rather than attempting comprehensive transformation immediately.
Phase 1: Audit Current State and Define Objectives
Begin by assessing existing visualization capabilities and identifying gaps. What data do you collect? How is it currently presented? Who are the stakeholders consuming data? What decisions should visualization inform? Where do current approaches fail to drive engagement or action?
Document specific objectives with measurable success criteria. Vague goals like "improve data presentation" lack actionable direction. Specific objectives like "reduce time from campaign launch to performance analysis from 3 days to same-day" or "increase percentage of team members regularly reviewing dashboards from 40% to 80%" provide clear targets guiding tool selection and implementation priorities.
Australian businesses should particularly identify Australian-specific requirements: integration with local platforms, compliance with Australian data regulations, accommodation of local market structures, and cultural preferences affecting visualization design. Tools optimized for US or European markets may require adaptation for Australian context.
Phase 2: Select Tools Matching Needs and Budget
Tool selection should balance sophistication against accessibility, capability against cost, and power against ease of use. Australian SMEs with limited budgets and non-technical teams prioritize accessible tools like Google Looker Studio (free), Databox (affordable with good mobile experience), or Canva (which now includes data visualization features). Growing businesses might invest in Power BI or Tableau providing greater sophistication. Enterprises may develop custom solutions using D3.js, Plotly, or other visualization libraries.
Evaluation criteria include integration with existing data sources (Google Analytics, social media platforms, CRM, email marketing, e-commerce), ease of use for non-technical stakeholders, mobile optimization for on-the-go access, collaboration features supporting distributed teams, pricing structure fitting Australian budgets (consider exchange rates for USD-priced tools), and vendor support quality and timezone coverage for Australian users.
Avoid over-buying capabilities you won't use. Sophisticated enterprise platforms waste resources if your team uses only basic features accessible through simpler tools. Conversely, don't compromise essential capabilities for minor cost savings—inadequate tools that don't serve business needs waste more through opportunity cost than tool subscription fees.
Phase 3: Implement Foundation Dashboards
Start with core dashboards addressing immediate business needs rather than attempting comprehensive visualization of every possible metric. Priority dashboards typically include campaign performance overview showing key metrics across all active campaigns, conversion funnel visualization identifying drop-off points, customer acquisition source analysis revealing which channels drive valuable customers, and website traffic and engagement metrics highlighting content effectiveness.
Design dashboards collaboratively with stakeholders who'll actually use them. What questions do they need answered? What decisions does visualization inform? What context helps interpretation? What level of detail is appropriate? User input during design ensures dashboards serve actual needs rather than designer assumptions about what stakeholders want.
Australian marketing teams should establish refresh schedules balancing timeliness against data processing resources. Real-time dashboards suit high-velocity activities like paid advertising requiring immediate optimization. Daily updates work for most marketing activities. Weekly aggregation suffices for longer-cycle strategic decisions. Match refresh frequency to decision cadence avoiding wasted processing on updates nobody reviews.
Phase 4: Train Teams and Establish Governance
Visualization tools deliver value only when teams use them effectively. Training should cover technical operation (how to access dashboards, apply filters, drill down), interpretation skills (understanding what visualizations mean, identifying patterns, distinguishing correlation from causation), and action protocols (who responds to insights, what thresholds trigger interventions, how decisions get documented).
Australian businesses should develop visualization governance ensuring consistency, accuracy, and appropriate access. Governance addresses data quality requirements feeding visualizations, standardized metrics definitions preventing confusion, visual design standards maintaining consistency, access controls protecting sensitive information, and documentation explaining methodology behind visualizations.
Regular review sessions where teams discuss dashboard insights, share learnings, and identify optimization opportunities reinforce visualization value whilst building data-driven culture. These sessions also surface issues—confusing visualizations, missing context, or unused dashboards—enabling continuous improvement.
Phase 5: Iterate Based on Usage and Impact
Treat visualization as evolving capability rather than one-time implementation. Monitor how stakeholders actually use dashboards, collect feedback about what works and what doesn't, track whether visualization correlates with improved decision-making and business outcomes, and refine based on learning.
Successful visualization programmes iterate continuously: deprecating unused dashboards, expanding successful ones, adding capabilities as teams develop sophistication, and experimenting with new visualization types or techniques. This evolution ensures visualization grows with business needs rather than becoming obsolete artifact of initial implementation.
Australian businesses should establish regular review cycles—perhaps quarterly—formally assessing visualization effectiveness and planning enhancements. This discipline prevents visualization from stagnating whilst ensuring resources focus on highest-value improvements rather than interesting-but-low-impact additions.

Case Studies: Australian Businesses Winning with Visualization
Several Australian businesses demonstrate effective visualization driving measurable engagement and conversion improvements, offering practical models for others following similar paths.
E-Commerce: Geographic Performance Optimization
A Sydney-based online retailer selling Australian-made homewares struggled with inefficient advertising spend across geographic markets. Aggregate metrics showed acceptable performance, but geographic visualization revealed dramatic variations: Melbourne converted at 4.2% whilst Brisbane managed only 1.8% despite similar traffic volumes.
Deep-dive visualization combining geographic performance with customer demographics, seasonal patterns, and competitor presence revealed that Brisbane's lower conversion reflected stronger local competition and different purchasing seasonality rather than poor product-market fit. Armed with these insights, the retailer adjusted Queensland strategy: shifting advertising spend toward autumn and winter when local demand peaked, emphasizing unique differentiators against Brisbane competitors, and targeting specific suburbs showing stronger affinity for Australian-made products.
Results demonstrated visualization's value: Brisbane conversion improved to 3.1% within three months, representing 72% increase and generating AU$340,000 additional revenue with identical advertising spend. The retailer expanded geographic visualization to other markets, identifying similar optimization opportunities in Perth and Adelaide.
Financial Services: Customer Journey Friction Reduction
A Melbourne fintech startup offering personal loans experienced frustrating conversion rates: 12% of applicants who started applications completed them, far below industry benchmarks. Traditional analytics identified drop-off points but not underlying causes.
Comprehensive customer journey visualization combining quantitative metrics (time spent per stage, form abandonment rates, error frequencies) with qualitative insights (customer service transcripts, survey responses, user testing) revealed three primary friction points: income verification requiring documents most applicants didn't have readily available, confusing eligibility criteria making applicants uncertain whether to proceed, and mobile experience breaking at critical stages forcing users to restart on desktop.
Visualization made insights actionable by showing emotional journey alongside process stages, revealing where frustration peaked and trust wavered. The startup implemented targeted improvements: simplified income verification using bank data with customer permission, clarified eligibility upfront with real-time calculator, and rebuilt mobile experience prioritizing completion over feature parity with desktop.
Conversion rate improved to 28%—more than doubling—within two months of implementation. Visualization continued monitoring journey health, alerting team to emerging friction points before they significantly impacted conversions.
Hospitality: Social Media Optimization
A Brisbane restaurant group managing six venues struggled optimizing social media presence across Instagram, Facebook, and TikTok. Content creation was expensive, results were inconsistent, and stakeholders couldn't agree on strategy due to conflicting interpretations of performance data.
Unified social media visualization consolidated metrics across platforms, venues, and content types, revealing patterns invisible in platform-native analytics. Video content drastically outperformed static images on all platforms. Behind-the-scenes kitchen content generated 3x engagement versus polished food photography. Posts featuring staff personalities built community more effectively than promotional content. Optimal posting times varied by venue reflecting different customer demographics.
Armed with these insights from clear visualization, the restaurant group restructured content strategy: shifted 70% of production budget toward video, created regular staff spotlight series, reduced promotional content from 60% to 20% of posts, and customized posting schedules per venue. Social media coordinator used live dashboards monitoring post performance, enabling real-time optimization of caption variations, hashtag combinations, and audience targeting.
Within six months, social media-driven reservations increased 156%, customer acquisition cost decreased 34%, and engagement rate improved from 2.1% to 5.8%. Visualization transformed social media from uncertain investment into measurable customer acquisition channel.
Common Mistakes: What Derails Visualization Initiatives
Understanding failure modes helps Australian businesses avoid common pitfalls undermining visualization effectiveness despite good intentions and adequate resources.
Visualization Without Strategy
The most common mistake involves creating dashboards and visualizations without clear strategic purpose. Teams build impressive-looking dashboards displaying dozens of metrics but lacking focus on decisions visualization should inform. This "dashboard for dashboard's sake" approach generates vanity metrics that look professional but drive no action.
Solution: Start with decisions, then determine which visualizations inform those decisions. Every dashboard should answer specific questions driving business actions. If you can't articulate what decisions visualization supports, don't build it.
Over-Complication and Feature Creep
Sophisticated visualization capabilities tempt teams toward over-complication, cramming every possible metric, dimension, and interactive feature into dashboards that become overwhelming rather than enlightening. The result: stakeholders avoid dashboards requiring excessive cognitive load to extract insights.
Solution: Ruthlessly prioritize clarity over comprehensiveness. Show the minimum information necessary to support decisions. Provide access to additional detail for those wanting deeper analysis, but don't force everyone to wade through complexity. Simple, focused visualization driving action beats comprehensive, complicated visualization generating paralysis.
Ignoring Mobile Experience
Many Australian stakeholders review dashboards primarily on smartphones during commutes, between meetings, or while travelling. Yet dashboards designed exclusively for desktop become unusable on mobile, rendering visualization inaccessible precisely when stakeholders have time to review them.
Solution: Design mobile-first or at minimum test rigorously on actual smartphones before deployment. What works on 27-inch monitors often fails on 6-inch screens. Responsive design isn't optional—it's fundamental to visualization accessibility.
Static Dashboards in Dynamic Environments
Business environments change continuously—new campaigns launch, market conditions shift, competitor actions disrupt assumptions. Static dashboards designed for previous business reality become misleading or irrelevant as circumstances evolve, yet teams continue consulting them making decisions based on outdated frameworks.
Solution: Establish regular dashboard review cycles questioning whether current visualizations still serve business needs. Deprecated dashboards that no longer inform decisions. Add new visualizations addressing emerging questions. Treat visualization as living capability requiring maintenance rather than one-time deliverable.
Neglecting Data Quality
Sophisticated visualization of low-quality data generates precisely wrong insights delivered with beautiful aesthetics and false confidence. Garbage in, garbage out applies regardless of visualization sophistication. Yet teams often prioritize dashboard design over data quality, creating impressive-looking visualizations built on unreliable foundations.
Solution: Invest in data quality before visualization. Ensure tracking is properly implemented, data is accurately collected, definitions are consistent, and edge cases are handled appropriately. Beautiful visualization of bad data is worse than ugly presentation of good data because it obscures quality issues whilst encouraging overconfident decision-making.
Ready to Transform Your Data Into Conversion Gold?
The difference between businesses that leverage data effectively and those drowning in it often comes down to visualization—transforming numbers into narratives, metrics into insights, and analysis into action. In Australian markets where competition intensifies and customer attention fragments, the ability to quickly understand data, identify opportunities, and execute optimizations determines who leads and who follows.
Maven Marketing Co specializes in helping Australian businesses develop data visualization strategies that drive measurable engagement and conversion improvements. We don't just create pretty dashboards—we build comprehensive visualization ecosystems connecting data to decisions, insights to actions, and metrics to meaningful business outcomes.
Our team combines technical expertise in visualization platforms with strategic marketing knowledge ensuring dashboards inform the decisions that matter most. From initial audit identifying visualization opportunities through tool selection, dashboard design, team training, and ongoing optimization, we guide you through every step of transformation from data-rich but insight-poor to data-driven and results-focused.
Don't let valuable insights hide in spreadsheets and static reports. Don't waste marketing budget because you can't quickly identify what works and what doesn't. Don't make strategic decisions based on intuition when data could inform better choices.
Visit mavenmarketingco.com.au today to schedule your data visualization strategy consultation. Let's audit your current data assets, identify conversion opportunities hiding in plain sight, and build visualization capabilities transforming how your team understands customers, optimizes campaigns, and drives measurable business results.
The future belongs to businesses that transform data into understanding faster than competitors. Let's build that future together—where every chart tells a story, every dashboard drives decisions, and every visualization contributes to the bottom line. Your data has value. Let's visualize it.

Table of contents
read more blogs

Handing the Keys to Google's AI: How to Keep Control of Your Ad Budget Inside Performance Max
Performance Max is Google's most automated campaign type, and also the one that provokes the most anxiety among Australian advertisers who have spent years developing campaign management practices that depend on visibility, control, and the ability to make deliberate, measurable changes. The anxiety has some basis. Performance Max does take more control away from the advertiser than any previous Google Ads campaign type: it chooses the placements, it selects the creative combinations, it determines the bid for each impression, and it distributes the budget across Google's inventory in ways the advertiser cannot directly specify. The part of the anxiety that is not well based is the conclusion that these constraints make Performance Max unmanageable or a blank cheque handed to Google's algorithm. Performance Max has a specific set of levers that, when correctly configured, give advertisers meaningful influence over where the budget goes, which audiences it targets, which creative assets it uses, and which conversion events it optimises toward. Understanding and using these levers is the difference between a Performance Max campaign that works within the advertiser's strategic parameters and one that wastes budget on inventory, audiences, and objectives that the business never intended to pursue.

When Customers Search on TikTok and Instagram Instead of Google — How Australian Brands Adapt
Something structurally significant has changed in how younger Australian consumers research purchases, and most Australian brands have not yet adjusted their discoverability strategy to reflect it. A proportion of the audience that would previously have opened Google to search for "best brunch spots Fitzroy" or "honest review Mecca skincare serum" is now opening TikTok or Instagram instead. They are searching within these platforms for short video content that shows them what they want to know: the actual food, the actual product, the actual experience, from people who have actually been there or used the item. This is not a marginal behaviour limited to a niche demographic. TikTok's own data has reported that a significant share of its users use the platform as a search engine, and the query patterns on Instagram's search function have expanded well beyond celebrity and hashtag discovery into product, venue, and service research. For Australian brands that have built their discoverability strategy entirely on Google organic search and Google Ads, this shift represents a gap that is growing over time as the audience that uses social platforms as primary discovery tools ages into demographics with higher purchasing power. This article covers what the shift to social search means practically, what content and account configuration signals these platforms use to surface results, and what Australian brands need to do differently to be found on TikTok and Instagram by people who are actively looking for what they offer.

How to Build a Google Business Profile That Converts Browsers Into Booked Appointments
A Google Business Profile that has been set up and left alone is doing roughly the same work as a shop front with the lights off. It confirms the business exists and provides the phone number, but it is not actively persuading a local searcher who is comparing three businesses in the search results to choose this one rather than the competitors sitting directly above and below it in the local pack. The businesses that win appointments from Google local search are not simply those that are closest to the searcher or those with the most reviews, although proximity and reviews both matter. They are the businesses that have treated their Google Business Profile as a conversion surface rather than a directory entry, and have populated every element of the profile with the specific information, imagery, and social proof that a local searcher needs to make a confident decision to book rather than keep browsing. The difference between a profile that ranks and converts and one that ranks but loses its potential customers to competitors is in the specific decisions this article covers: how to write the business description, which photos produce engagement, how to use posts to maintain freshness signals, how to respond to reviews in a way that builds rather than diminishes trust, and how to configure the booking and contact features that reduce friction between intent and appointment.


